

Question: 8, Below is the printout for a simple linear regression. (Must show step by step to get full credits) SUMMARY OUTPUT Regression Statistics Multiple R
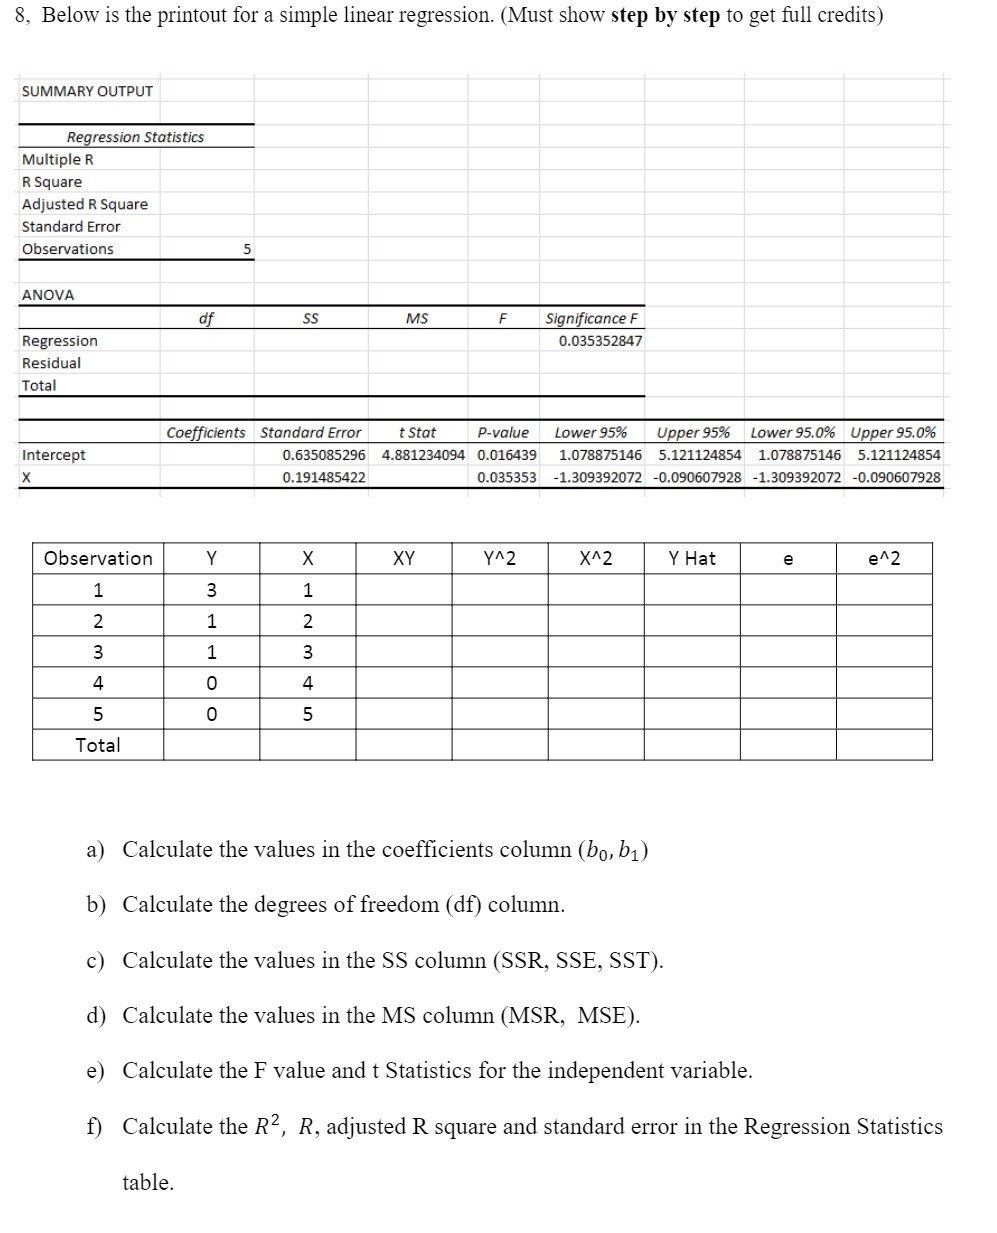
8, Below is the printout for a simple linear regression. (Must show step by step to get full credits) SUMMARY OUTPUT Regression Statistics Multiple R R Square Adjusted R Square Standard Error Observations ANOVA SS MS F Significance F Regression 0.035352847 Residual Total Coefficients Standard Error t Stat P-value Lower 95% Upper 95% Lower 95.0% Upper 95.0% Intercept 0.635085296 4.881234094 0.016439 1.078875146 5.121124854 1.078875146 5.121124854 0.191485422 0.035353 -1.309392072 -0.090607928 -1.309392072 -0.090607928 Observation Y X XY YA2 X12 Y Hat e e^2 1 3 1 2 1 2 1 3 0 5 0 Total a) Calculate the values in the coefficients column (bo, b1) b) Calculate the degrees of freedom (df) column. c) Calculate the values in the SS column (SSR, SSE, SST). d) Calculate the values in the MS column (MSR, MSE). e) Calculate the F value and t Statistics for the independent variable. f) Calculate the R2, R, adjusted R square and standard error in the Regression Statistics table
Step by Step Solution
There are 3 Steps involved in it

Get step-by-step solutions from verified subject matter experts