

Question: 8 ) Complete the table ( Figure 8 . 1 ) below for the figures from a business that has a monopoly on widgets Once
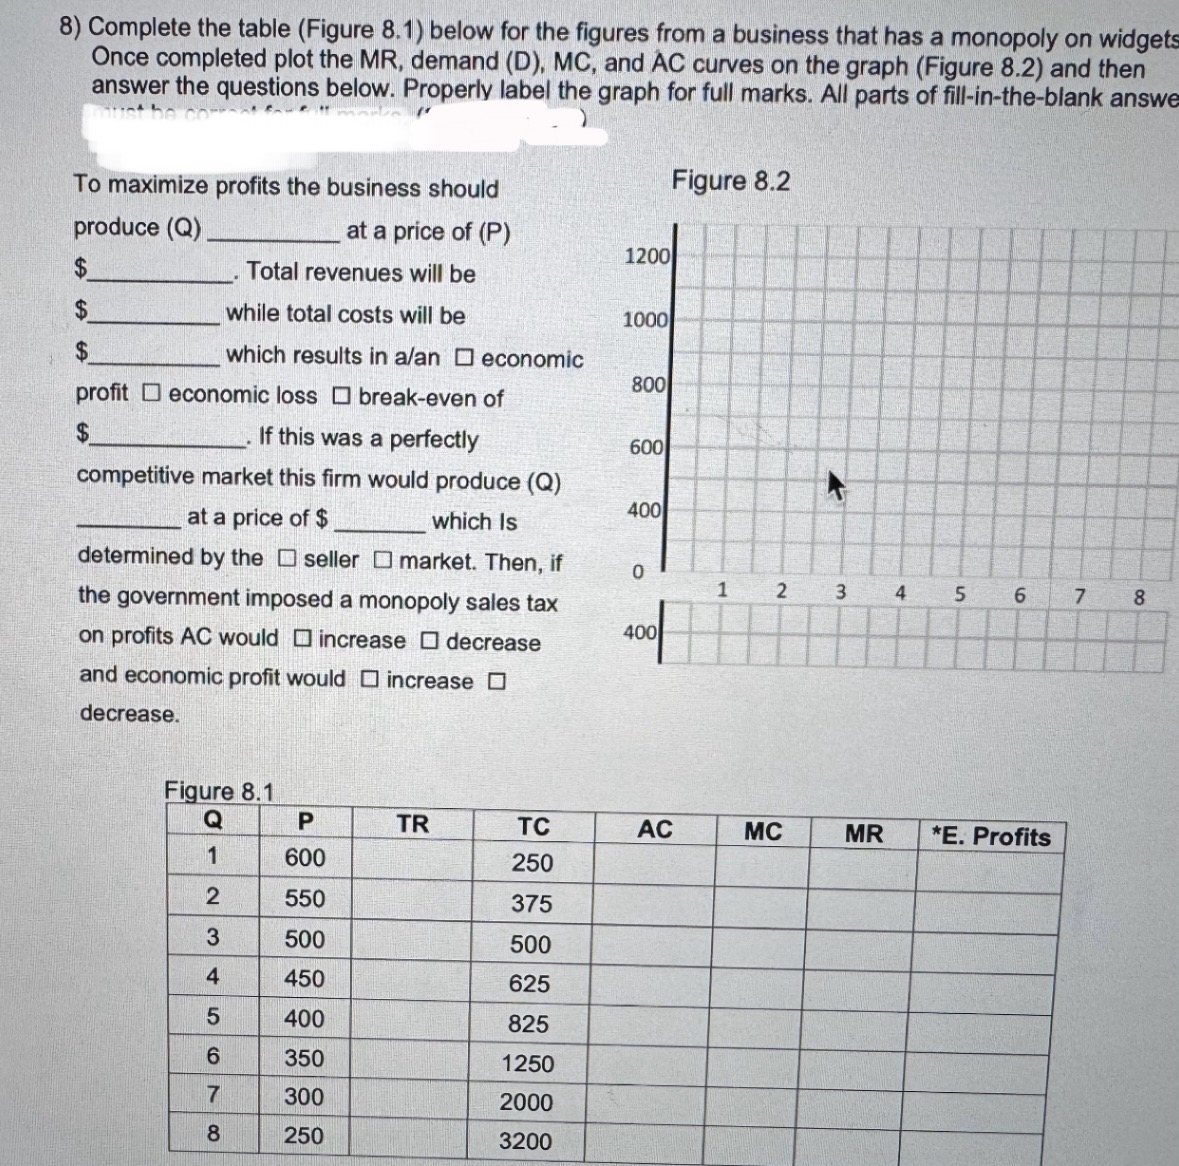
Complete the table Figure below for the figures from a business that has a monopoly on widgets Once completed plot the MR demand D MC and AC curves on the graph Figure and then answer the questions below. Properly label the graph for full marks. All parts of fillintheblank answe
To maximize profits the business should
Finure produce Q at a price of P
$
$
square while total costs will be
square which results in aan square economic profit square economic loss square breakeven of $ square If this was a perfectly competitive market this firm would produce Q at a price of $ square which Is determined by the square seller square market. Then, if the government imposed a monopoly sales tax on profits AC would square increase square decrease and economic profit would square increase decrease.
Figure
begintabularcccccccc
hline mathbfQ & mathbfP & TR & TC & AC & MC & MR & E Profits
hline & & & & & & &
hline & & & & & & &
hline & & & & & & &
hline & & & & & & &
hline & & & & & & &
hline & & & & & & &
hline & & & & & & &
hline & & & & & & &
hline
endtabular
Step by Step Solution
There are 3 Steps involved in it
1 Expert Approved Answer
Step: 1 Unlock

Question Has Been Solved by an Expert!
Get step-by-step solutions from verified subject matter experts
Step: 2 Unlock
Step: 3 Unlock