

Question: Complete the table below for the figures from a business that has a monopoly on widgets. Fixed costs are $15, and MC is $12. Once

Complete the table below for the figures from a business that has a monopoly on widgets. Fixed costs are $15, and MC is $12. Once completed plot the MR, demand (D), and MC curves on the graph and in your own words explain the relationship between the curves and price. Properly label the graph.
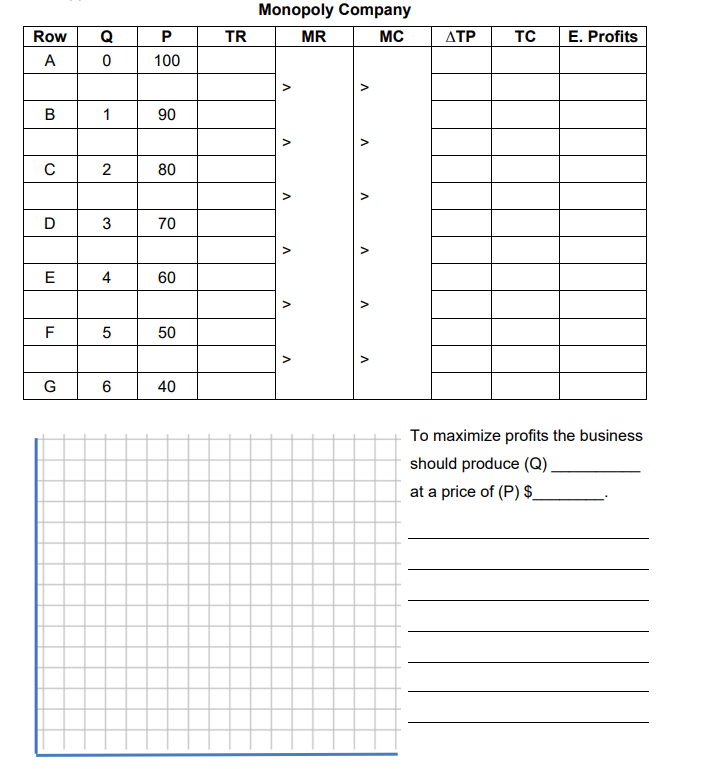
Monopoly Company Row Q P TR MR MC ATP A TC 100 E. Profits 3 > B 1 90 C 2 80 > D 3 70 E 4 60 F 5 50 G 6 40 To maximize profits the business should produce (Q) at a price of (P) $
Step by Step Solution
There are 3 Steps involved in it
1 Expert Approved Answer
Step: 1 Unlock

Question Has Been Solved by an Expert!
Get step-by-step solutions from verified subject matter experts
Step: 2 Unlock
Step: 3 Unlock