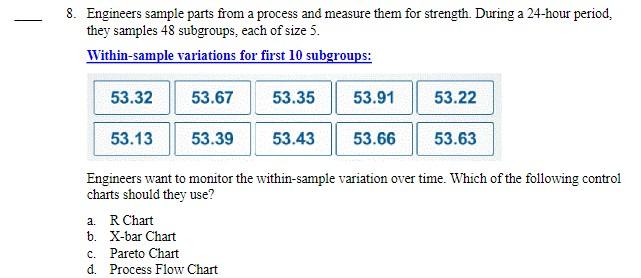
Question: 8. Engineers sample parts from a process and measure them for strength. During a 24-hour period, they samples 48 subgroups, each of size 5. Within-sample

8. Engineers sample parts from a process and

8. Engineers sample parts from a process and measure them for strength. During a 24-hour period, they samples 48 subgroups, each of size 5. Within-sample variations for first 10 subgroups: 53.32 53.67 53.35 53.91 53.22 53.13 53.39 53.43 53.66 53.63 Engineers want to monitor the within-sample variation over time. Which of the following control charts should they use? a. R Chart b. X-bar Chart c. Pareto Chart d. Process Flow Chart

Step by Step Solution

There are 3 Steps involved in it

1 Expert Approved Answer
Step: 1 Unlock blur-text-image
Question Has Been Solved by an Expert!

Get step-by-step solutions from verified subject matter experts

Step: 2 Unlock
Step: 3 Unlock

Students Have Also Explored These Related General Management Questions!