

Question: T. Engineers sample parts from a process and measure them for strength. During a 244mm period, the}r samples 43 subgroups, each of size 5. Within-sample

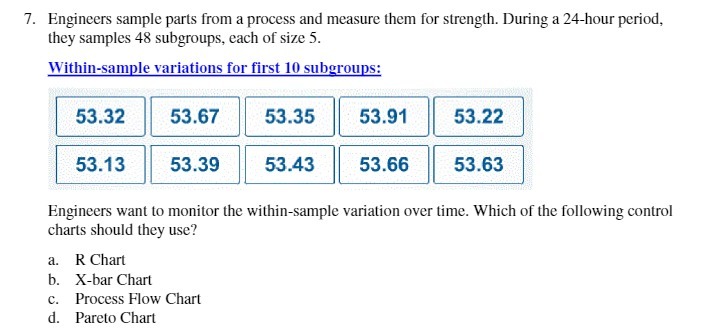
T. Engineers sample parts from a process and measure them for strength. During a 244mm period, the}r samples 43 subgroups, each of size 5. Within-sample variations for first It] suhgugs: \"WE Engineers want to monitor the 1tailrithinsample variation overtime. Which of the following control charts should they:r use? a. R Chart b. Xbar Chart c. Process Floatr Chart :1. Pareto Chart
Step by Step Solution
There are 3 Steps involved in it
1 Expert Approved Answer
Step: 1 Unlock

Question Has Been Solved by an Expert!
Get step-by-step solutions from verified subject matter experts
Step: 2 Unlock
Step: 3 Unlock