

Question: 8. Let g be a continuous function (that is, one with no jumps or holes in the graph) and suppose that a graph of
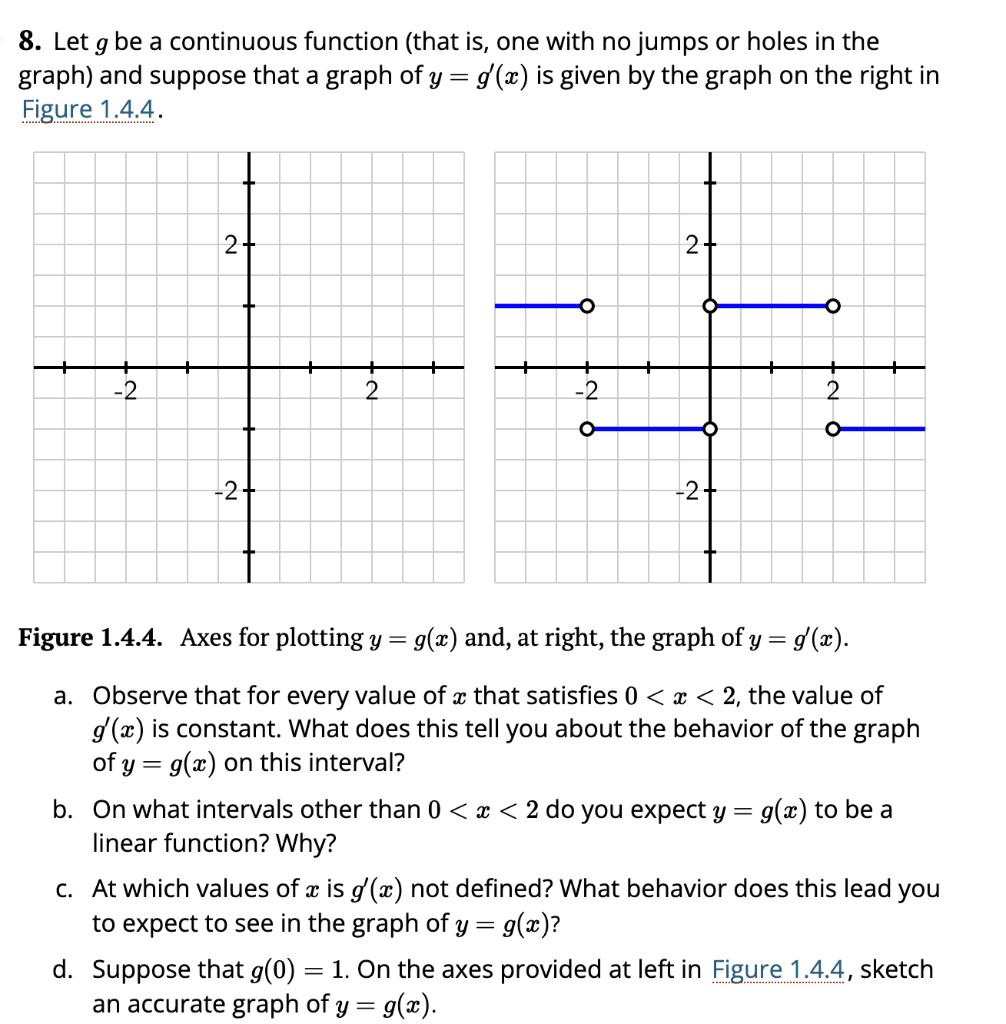
8. Let g be a continuous function (that is, one with no jumps or holes in the graph) and suppose that a graph of y = g'(x) is given by the graph on the right in Figure 1.4.4. -2 2- -2 2 -2 2+ -2+ = Figure 1.4.4. Axes for plotting y = g(x) and, at right, the graph of y = g'(x). a. Observe that for every value of x that satisfies 0 < x < 2, the value of g(x) is constant. What does this tell you about the behavior of the graph of y = g(x) on this interval? b. On what intervals other than 0 < x < 2 do you expect y: linear function? Why? 2 O g(x) to be a c. At which values of x is g'(x) not defined? What behavior does this lead you to expect to see in the graph of y = g(x)? d. Suppose that g(0) 1. On the axes provided at left in Figure 1.4.4, sketch an accurate graph of y = g(x).
Step by Step Solution
3.33 Rating (159 Votes )
There are 3 Steps involved in it
Solution a b C on the internal 02 linear In the int... View full answer

Get step-by-step solutions from verified subject matter experts