

Question: 8. NPV profiles An NPV profile plots a project's NPV at various costs of capital. An example NPV profile is shown below: Identify the range
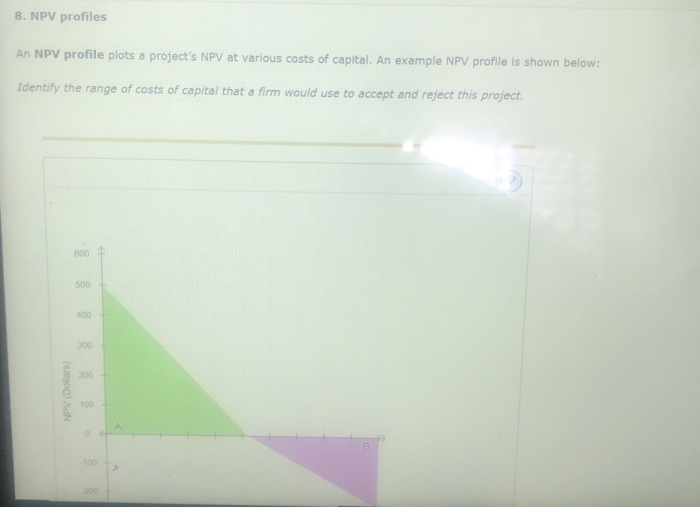
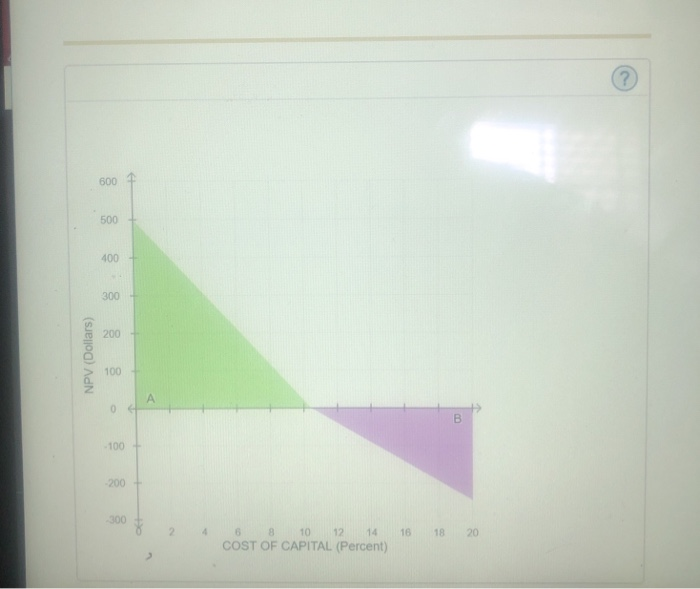
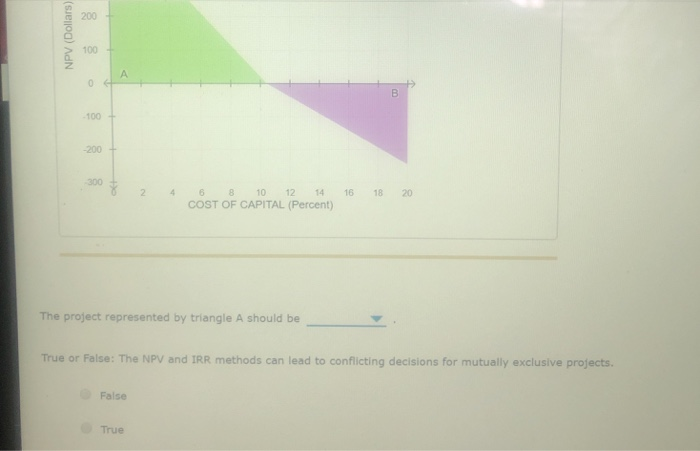
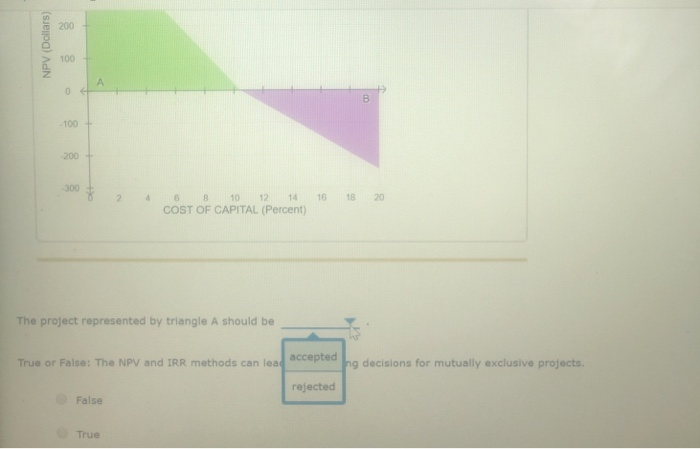
8. NPV profiles An NPV profile plots a project's NPV at various costs of capital. An example NPV profile is shown below: Identify the range of costs of capital that a firm would use to accept and reject this p 600 2 500 400 300 200 100 600 500 400 300 200 100 100 200+ 300 2 468 1012 14 16 18 20 COST OF CAPITAL (Percent) 200 100 100 200 300 2 468 1012 14 16 18 20 COST OF CAPITAL (Percent) The project represented by triangle A should be True or False: The NPV and IRR methods can lead to conflicting decisions for mutually exclusive projects. False True
Step by Step Solution
There are 3 Steps involved in it
1 Expert Approved Answer
Step: 1 Unlock

Question Has Been Solved by an Expert!
Get step-by-step solutions from verified subject matter experts
Step: 2 Unlock
Step: 3 Unlock