

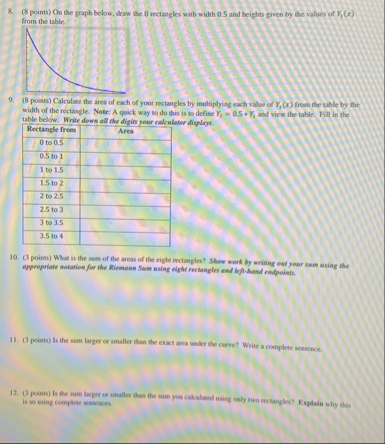
Question: ( 8 points ) On the graph below, draw the 8 rectangles with width 0 . 5 and heights given by the values of Y
points On the graph below, draw the rectangles with width and heights given by the values of from the table.
politis Calculate the area of each of your rectangles by multiplying each value of from the tuble by the width of the rectangle. Note: A quick way to do this is to define and view the table. Fill in the table below. Write down all the dipits vour cellentator fieptify.
tableRectangle frem,Area to to to to to to to to
points What is the sum of the areas of the eight mectangles? Shew work by writing out your sum using the appropriafe notation for ite Riemass Sum asing right reciangles and leftAnd endpoints.
points Is the sum larger or smaller than the exact area under the curve? Write a complete sentence.
Opoinis Is the sum larger or smaller thas the sum you calculated using coly tur rectangle? Explain shy dis is so sing complete sestraces.
Step by Step Solution
There are 3 Steps involved in it
1 Expert Approved Answer
Step: 1 Unlock

Question Has Been Solved by an Expert!
Get step-by-step solutions from verified subject matter experts
Step: 2 Unlock
Step: 3 Unlock