

Question: 8 Project network diagram a Duration, ES / EF , LS / LF , and slack for each project phase 9 Probability of completion within
Project network diagram
a Duration, ESEF LSLF and slack for each project phase
Probability of completion within days
a Crashing plan to ensure completion within weeks to within
Revised system failure rate with backups installed
a If failure rate is greater than which additional components should have backup
installed?
Can you answer these with this data set
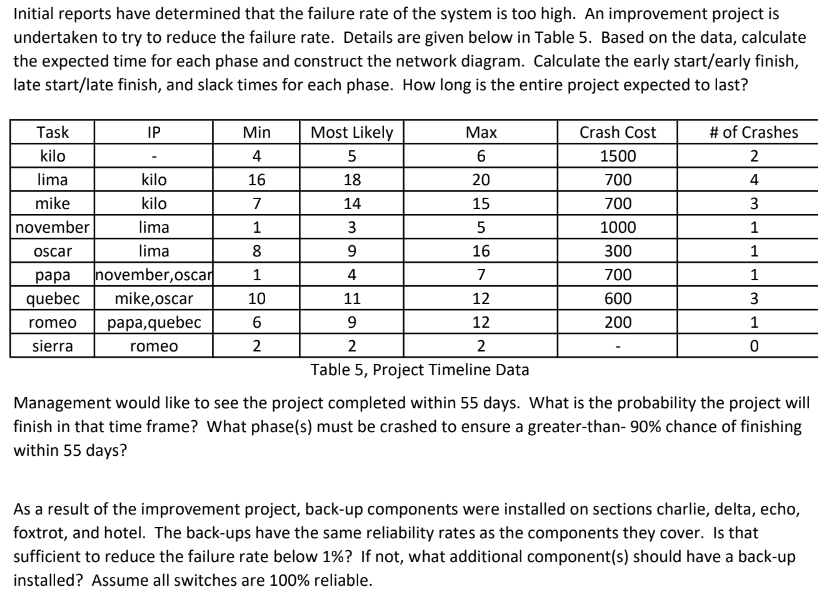
Initial reports have determined that the failure rate of the system is too high. An improvement project is
undertaken to try to reduce the failure rate. Details are given below in Table Based on the data, calculate
the expected time for each phase and construct the network diagram. Calculate the early startearly finish,
late startlate finish, and slack times for each phase. How long is the entire project expected to last?
Table Project Timeline Data
Management would like to see the project completed within days. What is the probability the project will
finish in that time frame? What phases must be crashed to ensure a greaterthan chance of finishing
within days?
As a result of the improvement project, backup components were installed on sections charlie, delta, echo,
foxtrot, and hotel. The backups have the same reliability rates as the components they cover. Is that
sufficient to reduce the failure rate below If not, what additional components should have a backup
installed? Assume all switches are reliable.
Step by Step Solution
There are 3 Steps involved in it
1 Expert Approved Answer
Step: 1 Unlock

Question Has Been Solved by an Expert!
Get step-by-step solutions from verified subject matter experts
Step: 2 Unlock
Step: 3 Unlock