

Question: 8 SP The following table shows the average nominal interest rates on six-month Treasury bills between 1971 and 1975, which determined the nominal interest
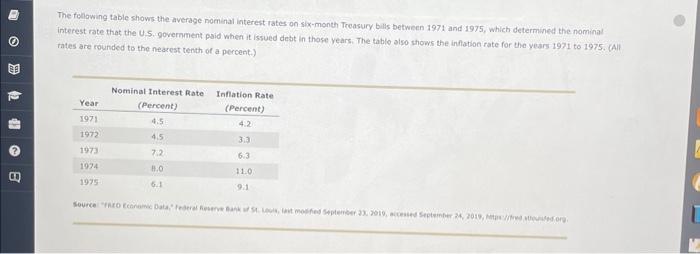
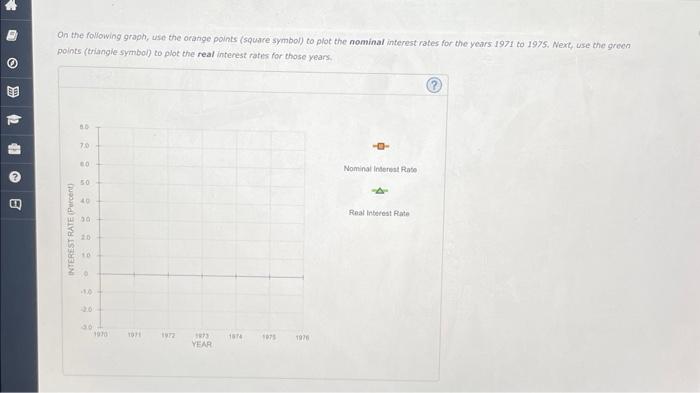

8 SP The following table shows the average nominal interest rates on six-month Treasury bills between 1971 and 1975, which determined the nominal interest rate that the U.S. government paid when it issued debt in those years. The table also shows the inflation rate for the years 1971 to 1975. (All rates are rounded to the nearest tenth of a percent.) Nominal Interest Rate Inflation Rate Year (Percent) (Percent) 1971 4.5 4.2 1972 4.5 3.3 1973 7.2 6.3 1974 1975 8.0 6.1 11.0 9.1 Source: "RED Economic Data," Federal Reserve Bank of St. Louis, last modified September 23, 2019, accessed September 24, 2019, https://fred soused.org
Step by Step Solution
There are 3 Steps involved in it

Get step-by-step solutions from verified subject matter experts