

Question: (8) The drag coefficient for spheres such as sporting balls is known to vary as a function of the Reynolds number Re, a dimensionless number
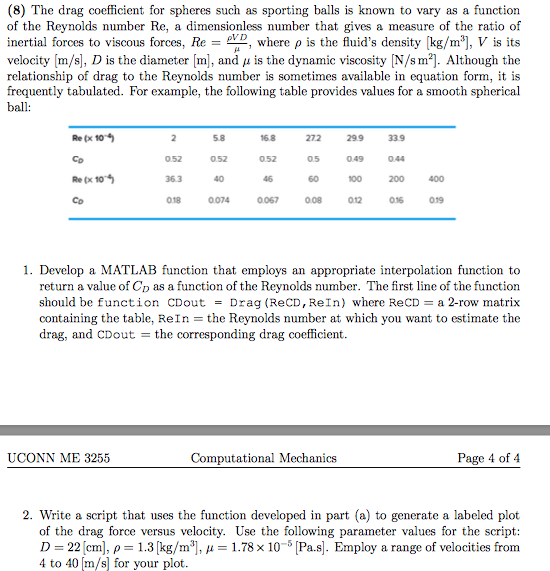
(8) The drag coefficient for spheres such as sporting balls is known to vary as a function of the Reynolds number Re, a dimensionless number that gives a measure of the ratio of inertial forces to viscous forces, Re, where p is the fluid's density [kg/m], V is its velocity [m/s), D is the diameter [m], and u is the dynamic viscosity [N/sm2]. Although the relationship of drag to the Reynolds number is sometimes available in equation form, it is frequently tabulated. For example, the following table provides values for a smooth spherical ball: 5.8 0.52 40 0074 16.8 052 46 299 0.49 100 067 008 012 272 0.5 60 339 Co 0.52 36.3 018 044 200 400 0% 019 Re (x 10 1. Develop a MATLAB function that employs an appropriate interpolation function to return a value of Cp as a function of the Reynolds number. The first line of the function should be function CDoutDrag (ReCD, ReIn) where ReCD a 2-row matrix containing the table, ReIn-the Reynolds number at which you want to estimate the drag, and CDout the coresponding drag coefficient UCONN ME 3255 Computational Mechanics Page 4 of 4 2. Write a script that uses the function developed in part (a) to generate a labeled plot of the drag force versus velocity. Use the following parameter values for the script: D 22 [cm], p 1.3 [kg/m3, 1.78 x 10 Pa.s]. Employ a range of velocities from 4 to 40 [m/s for your plot (8) The drag coefficient for spheres such as sporting balls is known to vary as a function of the Reynolds number Re, a dimensionless number that gives a measure of the ratio of inertial forces to viscous forces, Re, where p is the fluid's density [kg/m], V is its velocity [m/s), D is the diameter [m], and u is the dynamic viscosity [N/sm2]. Although the relationship of drag to the Reynolds number is sometimes available in equation form, it is frequently tabulated. For example, the following table provides values for a smooth spherical ball: 5.8 0.52 40 0074 16.8 052 46 299 0.49 100 067 008 012 272 0.5 60 339 Co 0.52 36.3 018 044 200 400 0% 019 Re (x 10 1. Develop a MATLAB function that employs an appropriate interpolation function to return a value of Cp as a function of the Reynolds number. The first line of the function should be function CDoutDrag (ReCD, ReIn) where ReCD a 2-row matrix containing the table, ReIn-the Reynolds number at which you want to estimate the drag, and CDout the coresponding drag coefficient UCONN ME 3255 Computational Mechanics Page 4 of 4 2. Write a script that uses the function developed in part (a) to generate a labeled plot of the drag force versus velocity. Use the following parameter values for the script: D 22 [cm], p 1.3 [kg/m3, 1.78 x 10 Pa.s]. Employ a range of velocities from 4 to 40 [m/s for your plot
Step by Step Solution
There are 3 Steps involved in it

Get step-by-step solutions from verified subject matter experts