

Question: 8. The following regression equation for quantity supplied was estimated using a sample of fifty observations. Q=2.2+0.104P. (3.4) (0.005) Standard errors are in the
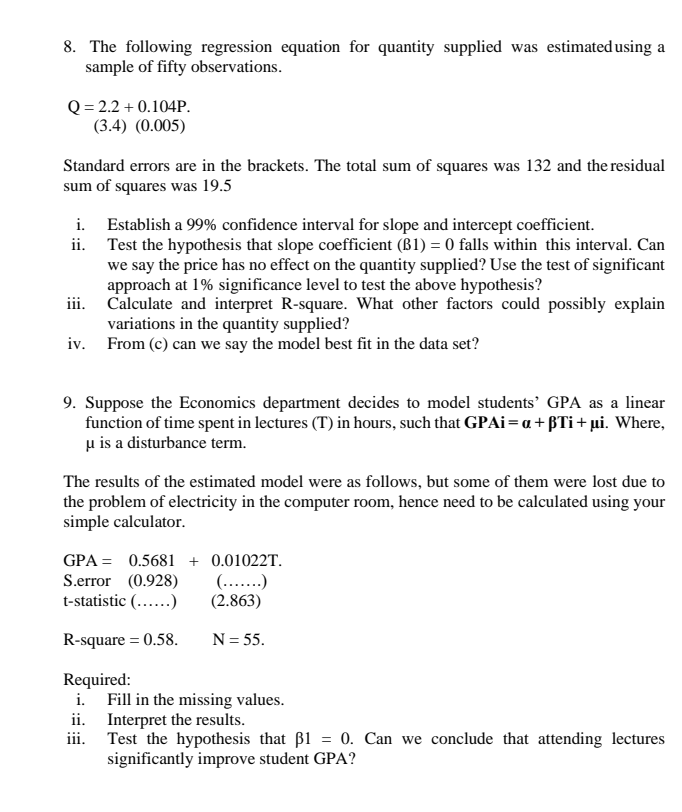
8. The following regression equation for quantity supplied was estimated using a sample of fifty observations. Q=2.2+0.104P. (3.4) (0.005) Standard errors are in the brackets. The total sum of squares was 132 and the residual sum of squares was 19.5 i. ii. Establish a 99% confidence interval for slope and intercept coefficient. Test the hypothesis that slope coefficient (B1) = 0 falls within this interval. Can we say the price has no effect on the quantity supplied? Use the test of significant approach at 1% significance level to test the above hypothesis? iii. Calculate and interpret R-square. What other factors could possibly explain variations in the quantity supplied? iv. From (c) can we say the model best fit in the data set? 9. Suppose the Economics department decides to model students' GPA as a linear function of time spent in lectures (T) in hours, such that GPAi=a+Ti+ui. Where, is a disturbance term. The results of the estimated model were as follows, but some of them were lost due to the problem of electricity in the computer room, hence need to be calculated using your simple calculator. GPA 0.5681 + 0.01022T. S.error (0.928) (.......) t-statistic (......) (2.863) R-square = 0.58. N = 55. Required: i. Fill in the missing values. ii. iii. Interpret the results. Test the hypothesis that 1 = 0. Can we conclude that attending lectures significantly improve student GPA?
Step by Step Solution
There are 3 Steps involved in it

Get step-by-step solutions from verified subject matter experts