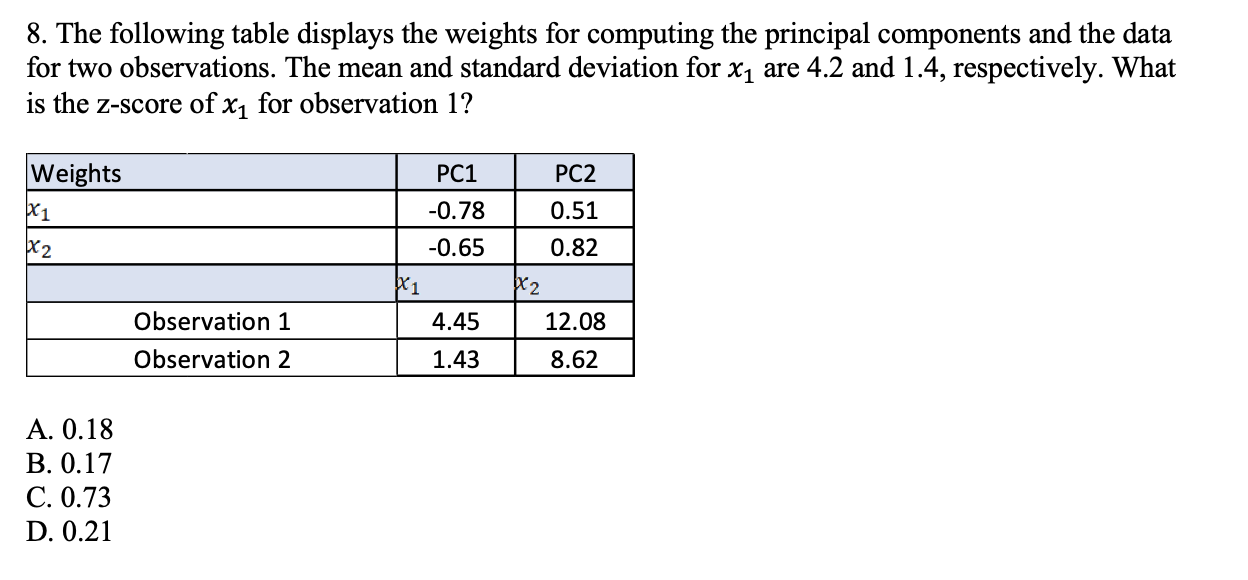
Question: 8. The following table displays the weights for computing the principal components and the data for two observations. The mean and standard deviation for X1

8. The following table displays the weights for

8. The following table displays the weights for computing the principal components and the data for two observations. The mean and standard deviation for X1 are 4.2 and 1.4, respectively. What is the z-score of X1 for observation 1? PC1 PC2 Weights X1 X2 -0.78 0.51 0.82 -0.65 1 2 4.45 12.08 Observation 1 Observation 2 1.43 8.62 A. 0.18 B. 0.17 C. 0.73 D. 0.21

Step by Step Solution

There are 3 Steps involved in it

1 Expert Approved Answer
Step: 1 Unlock blur-text-image
Question Has Been Solved by an Expert!

Get step-by-step solutions from verified subject matter experts

Step: 2 Unlock
Step: 3 Unlock

Students Have Also Explored These Related General Management Questions!