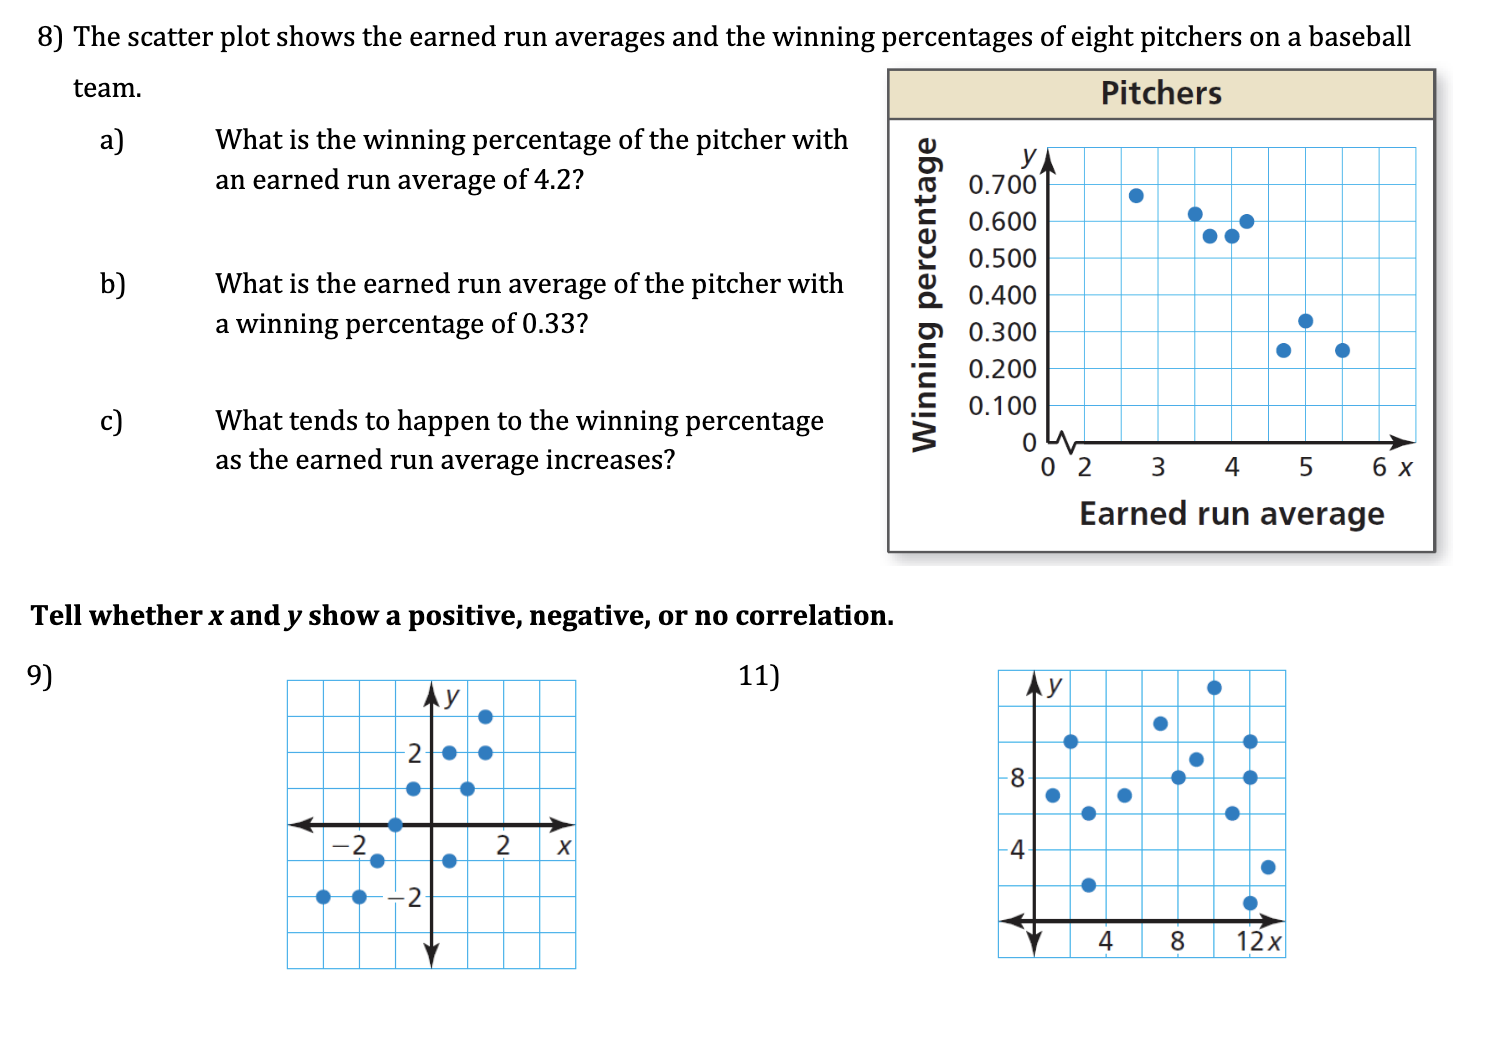
Question: 8) The scatter plot shows the earned run averages and the winning percentages of eight pitchers on a baseball team. Pitchers a What is the

8) The scatter plot shows the earned run averages
8) The scatter plot shows the earned run averages and the winning percentages of eight pitchers on a baseball team. Pitchers a What is the winning percentage of the pitcher with y an earned run average of 4.2? 0.700 0.600 0.500 What is the earned run average of the pitcher with Winning percentage 0.400 a winning percentage of 0.33? 0.300 0.200 0.100 c) What tends to happen to the winning percentage as the earned run average increases? 0 2 3 4 5 6 X Earned run average Tell whether x and y show a positive, negative, or no correlation. 9) 11) Ay 8 -20 2 X 4 2 4 8 12x

Step by Step Solution

There are 3 Steps involved in it

1 Expert Approved Answer
Step: 1 Unlock blur-text-image
Question Has Been Solved by an Expert!

Get step-by-step solutions from verified subject matter experts

Step: 2 Unlock
Step: 3 Unlock

Students Have Also Explored These Related Mathematics Questions!