

Question: 8. This problem is to be solved by hand. The weight and systolic blood pressure of 12 randomly selected males in the age group 25-30
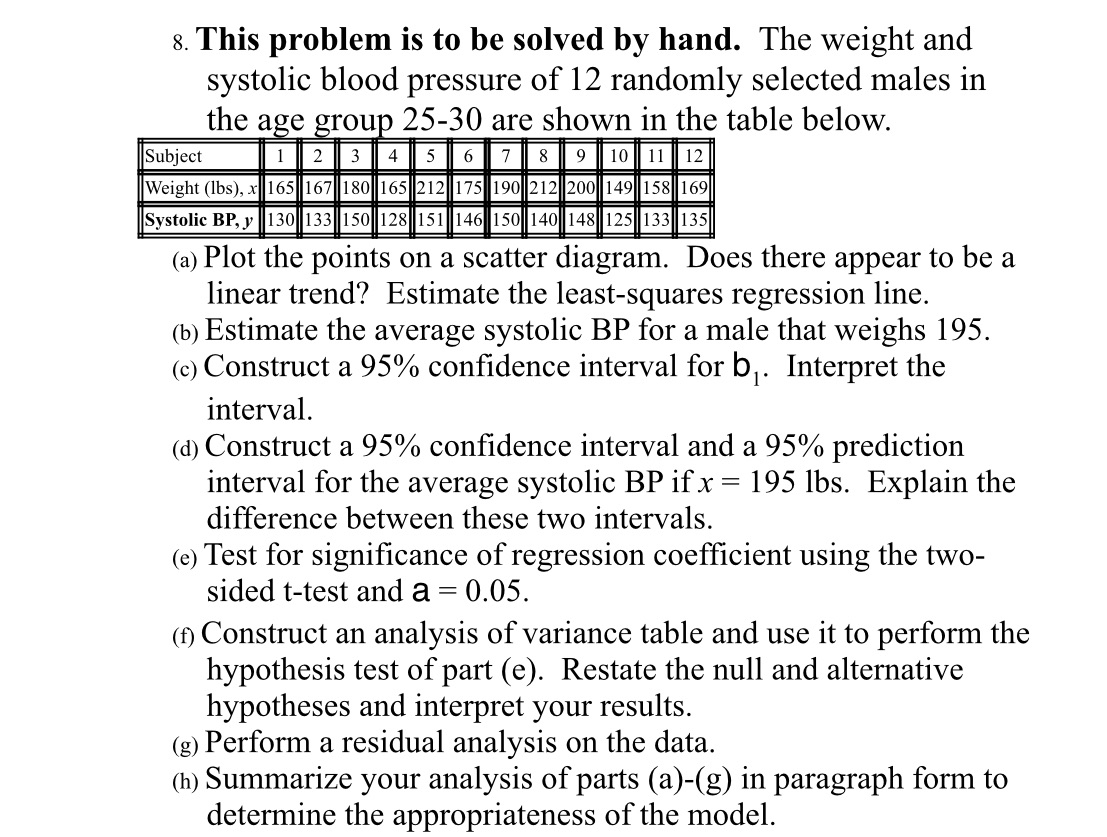
8. This problem is to be solved by hand. The weight and systolic blood pressure of 12 randomly selected males in the age group 25-30 are shown in the table below. Subject 1 2 3 4 5 6 8 9 10 12 Weight (lbs), x 165 167 180 165 212 175 190 212 200 149 158 69 Systolic BP, y 130 133 50 28 151 146 150 140 148 25 133 35 (a) Plot the points on a scatter diagram. Does there appear to be a linear trend? Estimate the least-squares regression line. (b) Estimate the average systolic BP for a male that weighs 195. (c) Construct a 95% confidence interval for b . Interpret the interval. (d) Construct a 95% confidence interval and a 95% prediction interval for the average systolic BP if x = 195 lbs. Explain the difference between these two intervals. (e) Test for significance of regression coefficient using the two- sided t-test and a = 0.05. (f) Construct an analysis of variance table and use it to perform the hypothesis test of part (e). Restate the null and alternative hypotheses and interpret your results. (g) Perform a residual analysis on the data. (h) Summarize your analysis of parts (a)-(g) in paragraph form to determine the appropriateness of the model
Step by Step Solution
There are 3 Steps involved in it

Get step-by-step solutions from verified subject matter experts