

Question: Consider the weight and blood pressure data in Problem 2.10. Fit a nointercept model to the data and compare it to the model obtained in
Consider the weight and blood pressure data in Problem 2.10. Fit a nointercept model to the data and compare it to the model obtained in Problem 2.10. Which model would you conclude is superior?
Data From Problem 2.10
The weight and systolic blood pressure of 26 randomly selected males in the age group 25-30 are shown below. Assume that weight and blood pressure (BP) are jointly normally distributed.
a. Find a regression line relating systolic blood pressure to weight.
b. Estimate the correlation coefficient.
c. Test the hypothesis that ρ=0.
d. Test the hypothesis that ρ=0.6.
e. Find a 95 CI for ρ.
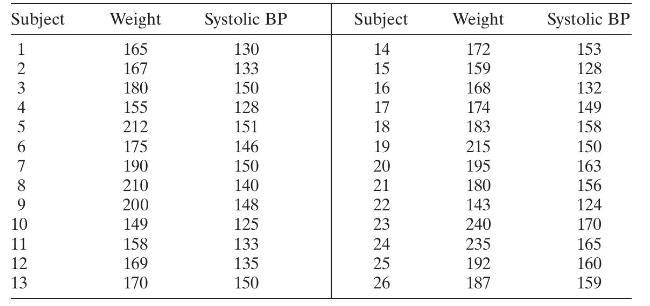
Subject Weight Systolic BP Subject Weight Systolic BP 1 165 130 14 172 153 2 167 133 15 159 128 3 180 150 16 168 132 4 155 128 17 174 149 567 212 151 18 183 158 175 146 19 215 150 190 150 20 195 163 8 210 140 21 180 156 9 200 148 22 143 124 10 149 125 23 240 170 11 158 133 24 235 165 12 169 135 25 192 160 13 170 150 26 187 159
Step by Step Solution
There are 3 Steps involved in it

Get step-by-step solutions from verified subject matter experts