

Question: 8. This table shows the NPV at certain rates for two projects. Create a line graph for each project using the graph below. (Make one
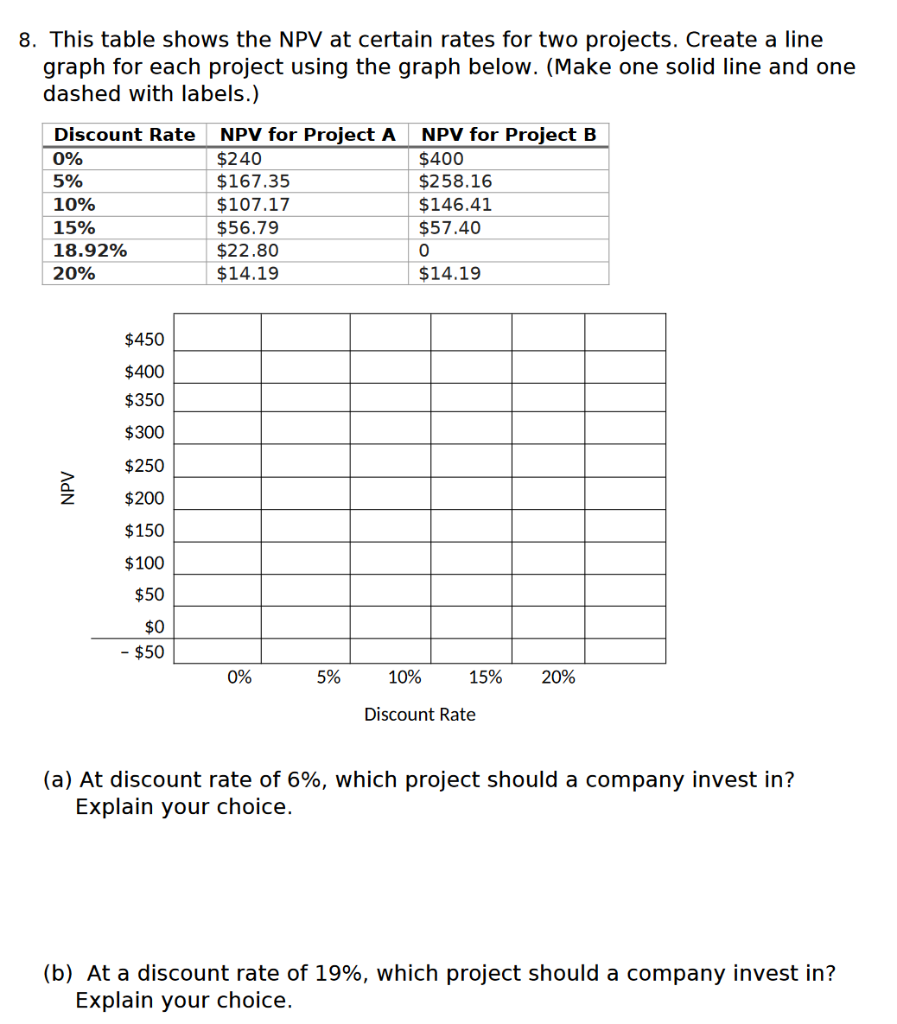
8. This table shows the NPV at certain rates for two projects. Create a line graph for each project using the graph below. (Make one solid line and one dashed with labels.) (a) At discount rate of 6%, which project should a company invest in? Explain your choice. (b) At a discount rate of 19%, which project should a company invest in? Explain your choice. 8. This table shows the NPV at certain rates for two projects. Create a line graph for each project using the graph below. (Make one solid line and one dashed with labels.) (a) At discount rate of 6%, which project should a company invest in? Explain your choice. (b) At a discount rate of 19%, which project should a company invest in? Explain your choice
Step by Step Solution
There are 3 Steps involved in it

Get step-by-step solutions from verified subject matter experts