

Question: 8) Use the box-and-whisker plot below to answer the question. 154 180 211 265 197.5 H 150 175 200 225 250 275 Cholesterol (in milligrams
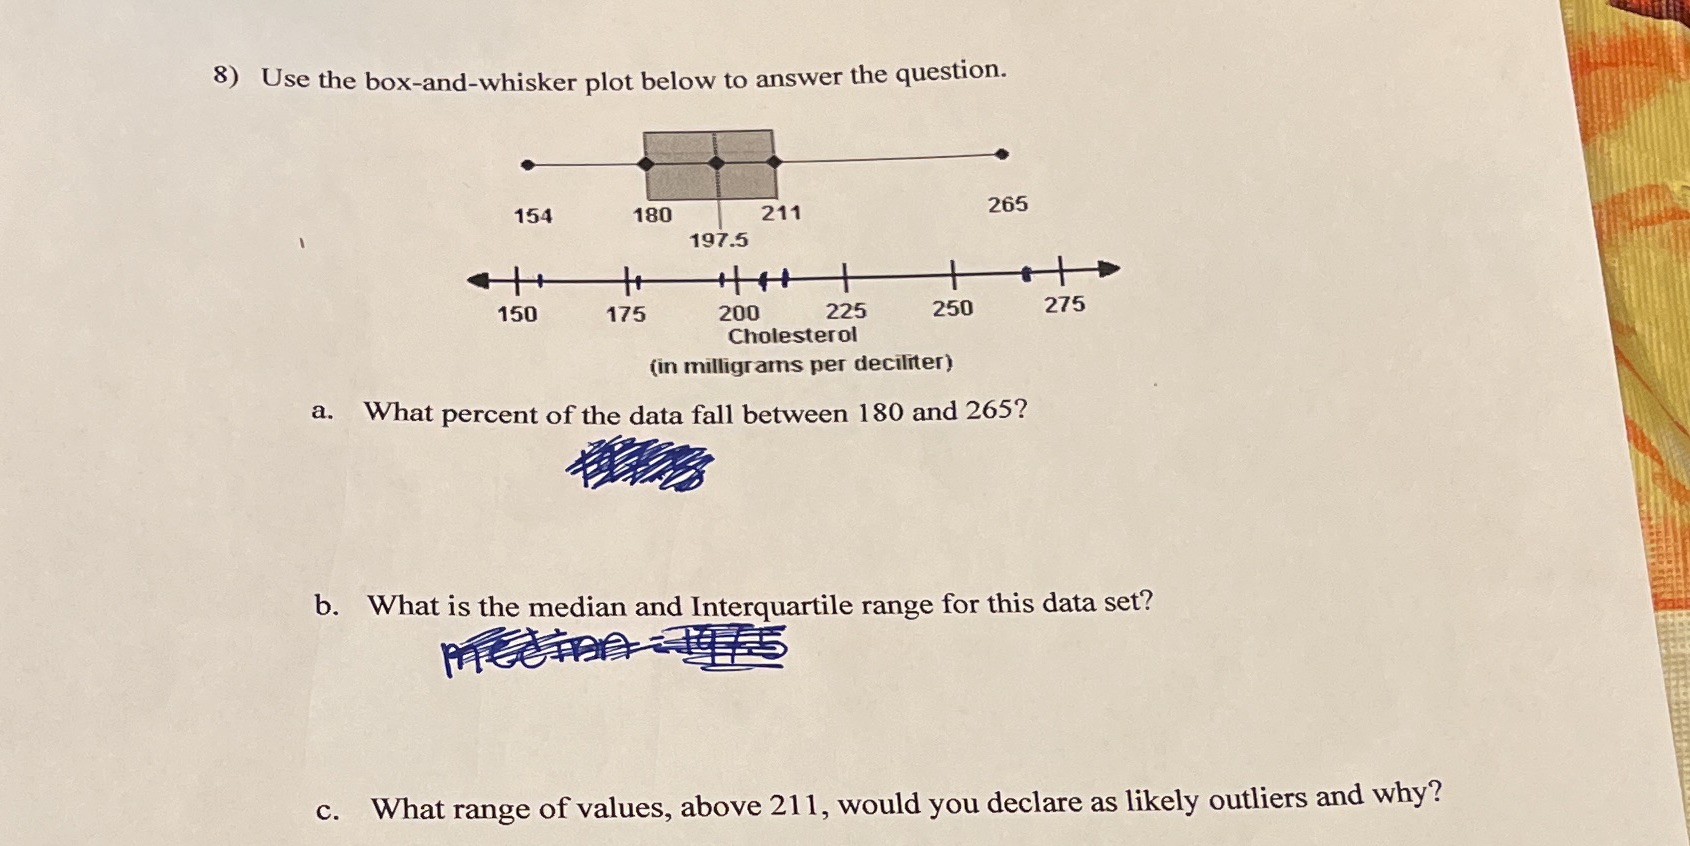
8) Use the box-and-whisker plot below to answer the question. 154 180 211 265 197.5 H 150 175 200 225 250 275 Cholesterol (in milligrams per deciliter) a. What percent of the data fall between 180 and 265? b. What is the median and Interquartile range for this data set? ATECTAA -TIES c. What range of values, above 211, would you declare as likely outliers and why
Step by Step Solution
There are 3 Steps involved in it
1 Expert Approved Answer
Step: 1 Unlock

Question Has Been Solved by an Expert!
Get step-by-step solutions from verified subject matter experts
Step: 2 Unlock
Step: 3 Unlock