

Question: An auditor is applying statistical sampling for attributes to the testing of extensions of 1000 line items on sales invoices. A deviation is defined as
An auditor is applying statistical sampling for attributes to the testing of extensions of 1000 line items on sales invoices. A deviation is defined as an extension mistake on a line (i.e. line #39 quantity of 10 and unit price of $100 is calculated as $900).
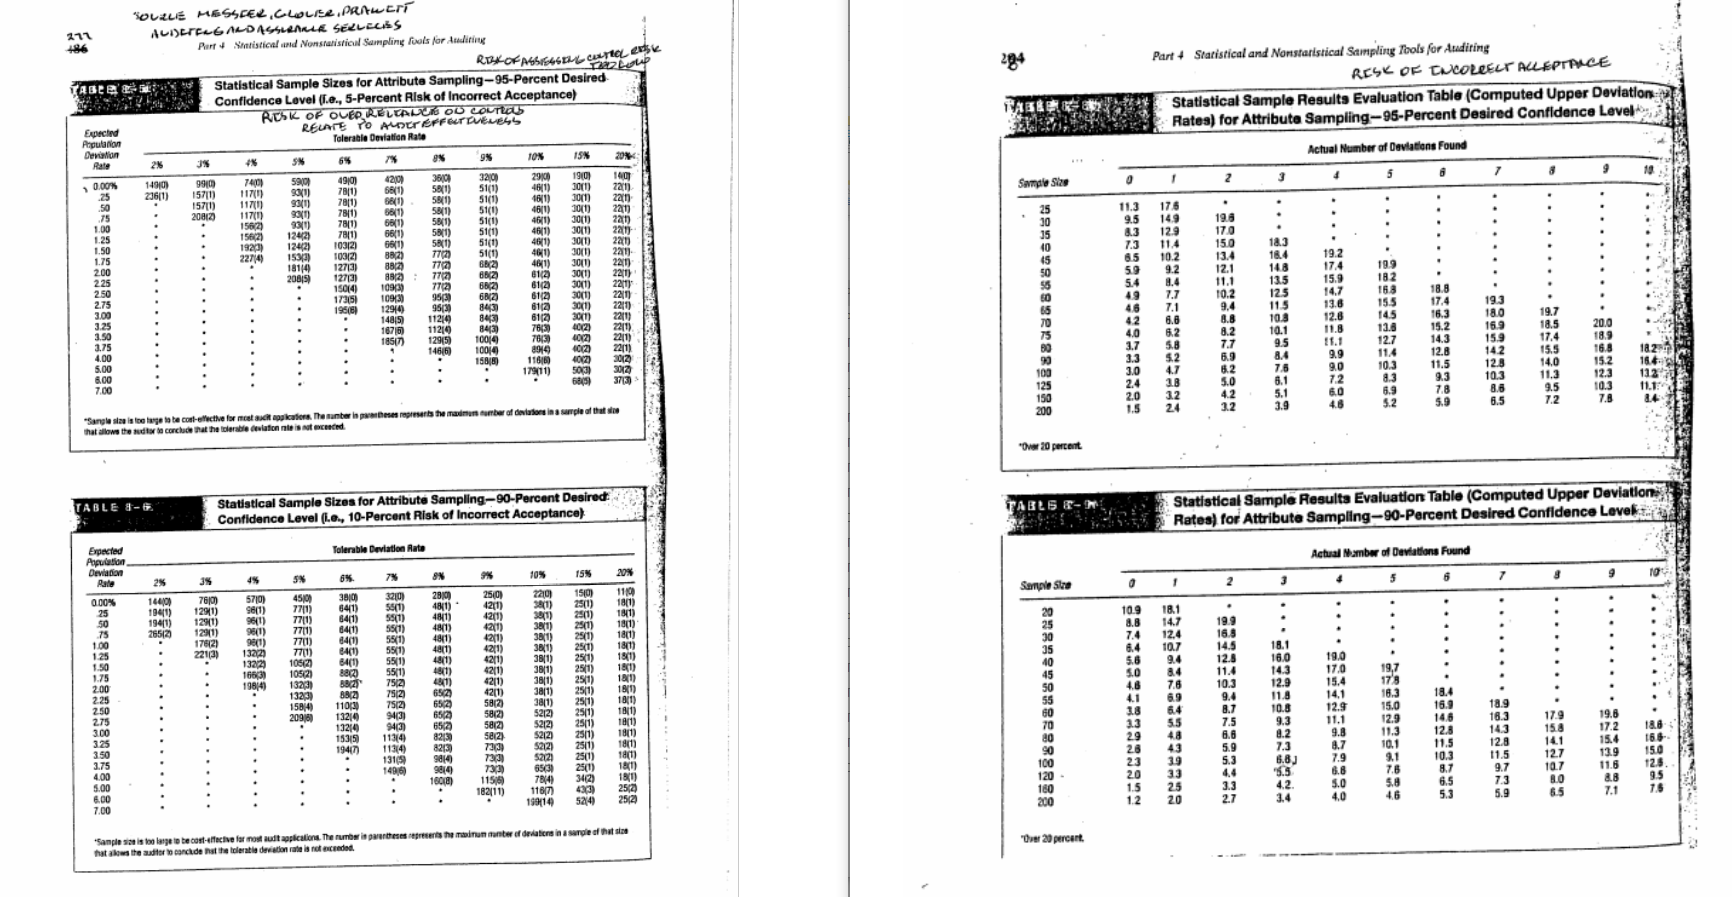
The auditor decides to use a 10% Risk of Overreliance, a Tolerable Deviation Rate of 6%, and an expected population deviation rate of 2%.
Assume the following deviation condition exists in the population (the auditor would not know this):
Line # Amount of deviation overstated (understated)
39 $ (100)
114 226
202 900
220 700
240 950
291 1126
347 226
410 (400)
413 850
526 550
600 1000
674 150
798 (500)
840 350
890 925
906 (820)
908 (1200)
971 200
Required
a. Calculate the sample size.
b. Take ONE sample using random selection. Regardless of your answer to part a, use a sample size of
100 lines. If you select a line number listed in the preceding deviation table, assume that a deviation
is found.
c. Quantitatively evaluate your sample results. [Use the sample decision rule.]
d. Assume that your sample contains so many deviations that you as the auditor conclude that controls
are not acceptable. Develop a population decision rule, as suggested in class. Use the population
decision rule to conclude that controls would be acceptable in this case.
e. Strictly as an overall Test of Controls, would the dollar amount of the deviations you found change
the evaluation of your results? Why or why not?
211 294 'SOUZLE MESSEEL.CLouise, pareri ALISETTE AD ASSLE SELLEUSS Purrt Statistical and Nonstatistical Sampling fools for Auditing RBK OF ASIAE Lou Statistical Sample Sizes for Attribute Sampling-95-Percent Desired Confidence Level (T.e., 5-Percent Risk of Incorrect Acceptance) RUSK OF OUED RELEALCI OD couro RELATE TO Aloer erfareness Tolerable Deviation Rate Tage Part + Statistical and Nonstatistical Sampling fools for Auditing RESE OF CUOLELT AULEPALCE Statistical Sample Results Evaluation Table (Computed Upper Deviation- Rates) for Attribute Sampling-95-Percent Desired Confidence Level Expected Population Devon Ratg Actual Number of Deviations Found 6% TOX 15% 78 48 20% SN 25 7 8 9 5 10 2 o 14910) 23611) 4200 66(1) Sarmale Size 9910 1571) 1570) 200123 740) 1170) 1170) 117(0) 158/21 1562) 1923) 22714) 590 sau 930 900 930 1242) 124/21 15319) 18114 2005) 176 14.9 12.9 30 35 10 490) 7811) 7810) 7811) 7811) 7810) 10312) 10312) 127131 127131 15014) 173151 19616) .25 50 75 1.00 1.25 1.50 1.75 200 225 2.50 2.75 3.00 3.25 3.50 1.75 4.00 5.00 6.00 7.00 5811) 6611) 660) 6611) 08:23 3812) 99/23 10913 10913 12914) 14815 1675) 18517 ON 3810 5810) 5841) 5) 5841) 580) 581) 77129 773 77123 77123 953) 95100 11214 11214 12915 1466 3210) 51(0) 51(1) 5100 51(0) 51(1) 5100) 51(0) 6/23 682 682 6812 840 843 843 10019 10014 15818 2910 4610) 160) 4611) 460) 46/1) 460) 460) 461) 612 6123 61122 6112 6112 7637 76130 8916 116180 17911) 1910) 30/0) 300 2011) 3000) 30/1 30/0) 3001 3011 30(1) 3000) 3011) 30(1) 3000) 4012) 2012) 012 40120 503) 6805 140 22:1) 221 2017 220 2013 221 221) 2211 2211) 22/01 22/0) 22/0) 2210 2211) 2211) 22/1) 2012 3012 373) 50 58 60 65 70 75 11.3 9.5 6.3 7.3 85 5.9 5.4 49 46 42 4.0 1.7 3.3 3.0 2.4 2.0 10.2 9.2 9.4 7.7 7.1 6.8 5.2 5.8 5.2 47 2.8 3.2 19.6 170 15.0 13.4 12.1 11.1 10.2 9.4 8.8 8.2 7.7 6.9 8.2 5.0 4.2 3.2 18.3 16.4 14.8 13.5 12.5 11.5 10.3 10.1 9.5 8.4 19.2 17.4 15.9 14.7 13.6 12.6 11.8 11.1 9.9 90 7.2 6.0 4.8 19.9 182 163 15.5 14.5 13.8 12.7 114 103 8.3 6.9 5.2. 18.8 17.4 16.3 15.2 14.3 12.8 11.5 9.3 7.8 5.9 193 18.0 16.9 15.9 142 12.8 10.3 8.8 6.5 20.0 18.9 16.8 90 100 125 150 200 19.7 18.5 17.4 15.5 14.0 11.3 9.5 7.2 182 16.4 132 11.11 6.1 5.1 3.9 12.3 10.3 7.8 Sangles is toege to be collective formalitations. The stories represents the manunumber of losingle of that that allows the conclude that the table elationnels de Over 20 percent TABLE - Statistical Sample Sizes for Attribute Sampling-90-Percent Desired Confidence Level (i.e., 10-Percent Risk of Incorrect Acceptance) TABLE Statistical Sample Resulta Evaluation Table (Computed Upper Deviations Rates) for Attribute Sampling-90-Percent Desired Confidence Level: Tolerable Deviation Rate Actual Nambw of Deviation Found Expected Population Diviation Rate 20% SN 56 155 5% 6% 10 49 35 25 8 5 6 7 2 + 3 1 0 Sample Size 1440) 1941) 1941) 26512 . 7610 1291) 1291) 12911) 176121 221(3) 5710) 960) 960 9810) 9800) 132/2) 1322 1663) 19814 450) 7711) 7710) 7711) 770) 770) 106122 10512) 1323) 132,3) 158/4) 2098) 3810) 6411) 640) 84111 84011 84(0) 8400 8817 88023 882 11011 13214 13214 15315 1947 0.00% 25 50 75 100 1.25 1.50 1.75 200 225 250 275 300 325 350 3.75 400 5.00 8.00 7.00 7% 320) 590) 55(1) 550) 5501) 55(1) 551) 55111 7512 7512 7512 943) 943 11314 11314) 1318 1496 2009 4811) 4811) 48(1) 4811) 4811) 4801) 1811) 2500) 42(1) 4200) 421) 1210 4210) 4210) 42/0) 4210) 4211 5812 5812) 5812 se 2] 733) 7303 733) 1156) 182/11) 220 320) 320) 380) 381) 380) 380) 3810) 380) 3811 381) 5212) $212) $2121 $2121 5212 650 7814 11617) 19014 1510) 25/1) 2500) 2500) 2501) 2500) 25:0) 25/0) 251) 25(1) 25(1) 2511) 2511) 2500) 2511) 2500) 250) 342) 433) 524) 1110 1801 180) 1800) 1800) 18011 18001 1600) 10/12 18:11 1841) 1811) 181) 1811) 1861 180 181) 180) 25/2 2512 35 40 45 50 55 60 70 652 65.2 6512 652 8213) 8213) 9014 9814 16018) 10.9 8.8 7.4 6.4 5.6 5.0 4.8 4.1 18 1.3 29 18.1 14.7 12.4 107 9.4 8.4 7.6 69 199 16.9 14.5 12.8 11.4 10.3 9.4 8.7 7.5 6.6 5.9 5.3 18.1 160 14.3 12.9 11.3 10.8 9.3 8.2 7.3 6.8 "SS 18.9 19.0 17.0 15.4 14.1 12.9 11.1 9.8 8.7 7.9 6.8 S.O 4,0 19,7 17's 16.3 15.0 12.9 11.3 10.1 9.1 7.6 5.8 46 55 48 43 39 33 25 20 18.4 16.9 14.6 12.8 11.5 10.3 9.7 6.5 5.3 90 100 120 180 200 17.9 15.8 14.1 127 107 8.0 65 143 12.3 11.5 9.7 7.3 5.9 23 20 1.5 12 19,8 17.2 15.4 13.9 11.6 8.8 7.1 18.8 166 150 125 95 1.6 3.3 "Over 20 percent Sangles is to get to be cost-effective for most audit applications. The number these teens the main ber of deviations in a sample of the that the auditorio conc.de the tertia devetion rate is not exceeded 211 294 'SOUZLE MESSEEL.CLouise, pareri ALISETTE AD ASSLE SELLEUSS Purrt Statistical and Nonstatistical Sampling fools for Auditing RBK OF ASIAE Lou Statistical Sample Sizes for Attribute Sampling-95-Percent Desired Confidence Level (T.e., 5-Percent Risk of Incorrect Acceptance) RUSK OF OUED RELEALCI OD couro RELATE TO Aloer erfareness Tolerable Deviation Rate Tage Part + Statistical and Nonstatistical Sampling fools for Auditing RESE OF CUOLELT AULEPALCE Statistical Sample Results Evaluation Table (Computed Upper Deviation- Rates) for Attribute Sampling-95-Percent Desired Confidence Level Expected Population Devon Ratg Actual Number of Deviations Found 6% TOX 15% 78 48 20% SN 25 7 8 9 5 10 2 o 14910) 23611) 4200 66(1) Sarmale Size 9910 1571) 1570) 200123 740) 1170) 1170) 117(0) 158/21 1562) 1923) 22714) 590 sau 930 900 930 1242) 124/21 15319) 18114 2005) 176 14.9 12.9 30 35 10 490) 7811) 7810) 7811) 7811) 7810) 10312) 10312) 127131 127131 15014) 173151 19616) .25 50 75 1.00 1.25 1.50 1.75 200 225 2.50 2.75 3.00 3.25 3.50 1.75 4.00 5.00 6.00 7.00 5811) 6611) 660) 6611) 08:23 3812) 99/23 10913 10913 12914) 14815 1675) 18517 ON 3810 5810) 5841) 5) 5841) 580) 581) 77129 773 77123 77123 953) 95100 11214 11214 12915 1466 3210) 51(0) 51(1) 5100 51(0) 51(1) 5100) 51(0) 6/23 682 682 6812 840 843 843 10019 10014 15818 2910 4610) 160) 4611) 460) 46/1) 460) 460) 461) 612 6123 61122 6112 6112 7637 76130 8916 116180 17911) 1910) 30/0) 300 2011) 3000) 30/1 30/0) 3001 3011 30(1) 3000) 3011) 30(1) 3000) 4012) 2012) 012 40120 503) 6805 140 22:1) 221 2017 220 2013 221 221) 2211 2211) 22/01 22/0) 22/0) 2210 2211) 2211) 22/1) 2012 3012 373) 50 58 60 65 70 75 11.3 9.5 6.3 7.3 85 5.9 5.4 49 46 42 4.0 1.7 3.3 3.0 2.4 2.0 10.2 9.2 9.4 7.7 7.1 6.8 5.2 5.8 5.2 47 2.8 3.2 19.6 170 15.0 13.4 12.1 11.1 10.2 9.4 8.8 8.2 7.7 6.9 8.2 5.0 4.2 3.2 18.3 16.4 14.8 13.5 12.5 11.5 10.3 10.1 9.5 8.4 19.2 17.4 15.9 14.7 13.6 12.6 11.8 11.1 9.9 90 7.2 6.0 4.8 19.9 182 163 15.5 14.5 13.8 12.7 114 103 8.3 6.9 5.2. 18.8 17.4 16.3 15.2 14.3 12.8 11.5 9.3 7.8 5.9 193 18.0 16.9 15.9 142 12.8 10.3 8.8 6.5 20.0 18.9 16.8 90 100 125 150 200 19.7 18.5 17.4 15.5 14.0 11.3 9.5 7.2 182 16.4 132 11.11 6.1 5.1 3.9 12.3 10.3 7.8 Sangles is toege to be collective formalitations. The stories represents the manunumber of losingle of that that allows the conclude that the table elationnels de Over 20 percent TABLE - Statistical Sample Sizes for Attribute Sampling-90-Percent Desired Confidence Level (i.e., 10-Percent Risk of Incorrect Acceptance) TABLE Statistical Sample Resulta Evaluation Table (Computed Upper Deviations Rates) for Attribute Sampling-90-Percent Desired Confidence Level: Tolerable Deviation Rate Actual Nambw of Deviation Found Expected Population Diviation Rate 20% SN 56 155 5% 6% 10 49 35 25 8 5 6 7 2 + 3 1 0 Sample Size 1440) 1941) 1941) 26512 . 7610 1291) 1291) 12911) 176121 221(3) 5710) 960) 960 9810) 9800) 132/2) 1322 1663) 19814 450) 7711) 7710) 7711) 770) 770) 106122 10512) 1323) 132,3) 158/4) 2098) 3810) 6411) 640) 84111 84011 84(0) 8400 8817 88023 882 11011 13214 13214 15315 1947 0.00% 25 50 75 100 1.25 1.50 1.75 200 225 250 275 300 325 350 3.75 400 5.00 8.00 7.00 7% 320) 590) 55(1) 550) 5501) 55(1) 551) 55111 7512 7512 7512 943) 943 11314 11314) 1318 1496 2009 4811) 4811) 48(1) 4811) 4811) 4801) 1811) 2500) 42(1) 4200) 421) 1210 4210) 4210) 42/0) 4210) 4211 5812 5812) 5812 se 2] 733) 7303 733) 1156) 182/11) 220 320) 320) 380) 381) 380) 380) 3810) 380) 3811 381) 5212) $212) $2121 $2121 5212 650 7814 11617) 19014 1510) 25/1) 2500) 2500) 2501) 2500) 25:0) 25/0) 251) 25(1) 25(1) 2511) 2511) 2500) 2511) 2500) 250) 342) 433) 524) 1110 1801 180) 1800) 1800) 18011 18001 1600) 10/12 18:11 1841) 1811) 181) 1811) 1861 180 181) 180) 25/2 2512 35 40 45 50 55 60 70 652 65.2 6512 652 8213) 8213) 9014 9814 16018) 10.9 8.8 7.4 6.4 5.6 5.0 4.8 4.1 18 1.3 29 18.1 14.7 12.4 107 9.4 8.4 7.6 69 199 16.9 14.5 12.8 11.4 10.3 9.4 8.7 7.5 6.6 5.9 5.3 18.1 160 14.3 12.9 11.3 10.8 9.3 8.2 7.3 6.8 "SS 18.9 19.0 17.0 15.4 14.1 12.9 11.1 9.8 8.7 7.9 6.8 S.O 4,0 19,7 17's 16.3 15.0 12.9 11.3 10.1 9.1 7.6 5.8 46 55 48 43 39 33 25 20 18.4 16.9 14.6 12.8 11.5 10.3 9.7 6.5 5.3 90 100 120 180 200 17.9 15.8 14.1 127 107 8.0 65 143 12.3 11.5 9.7 7.3 5.9 23 20 1.5 12 19,8 17.2 15.4 13.9 11.6 8.8 7.1 18.8 166 150 125 95 1.6 3.3 "Over 20 percent Sangles is to get to be cost-effective for most audit applications. The number these teens the main ber of deviations in a sample of the that the auditorio conc.de the tertia devetion rate is not exceeded
Step by Step Solution
There are 3 Steps involved in it

Get step-by-step solutions from verified subject matter experts