

Question: | 80% 80% 95% 95% lower upper lower upper limit limit limit limit S1 90.2 88.7 80% confidence intervals 95% confidence intervals 91.7 87.9
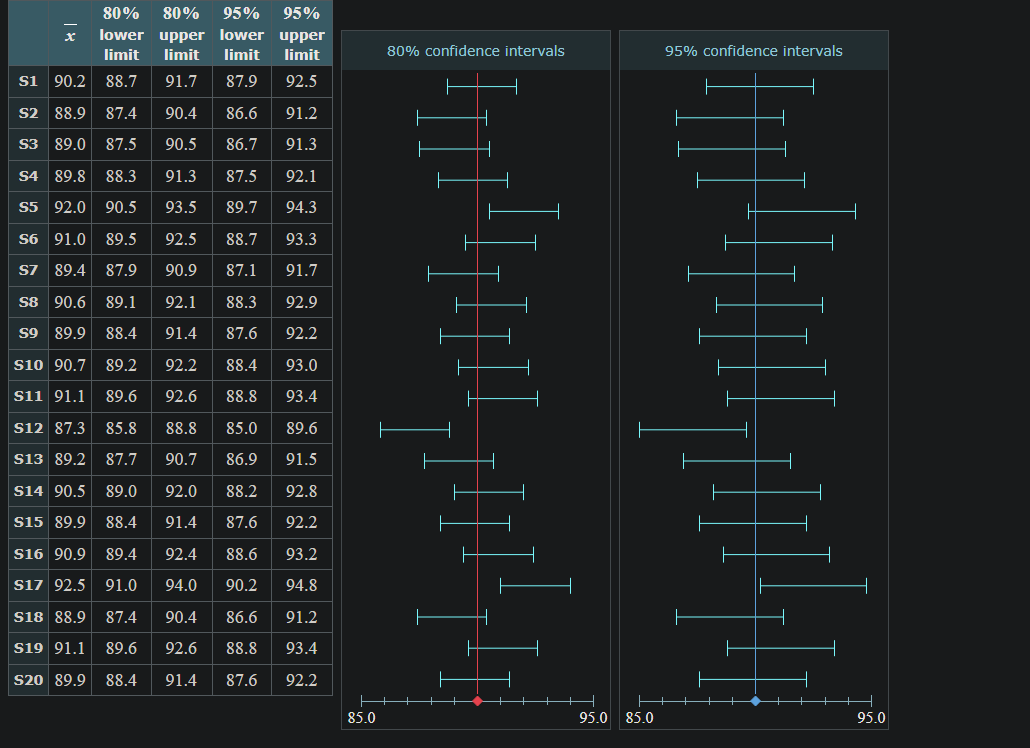
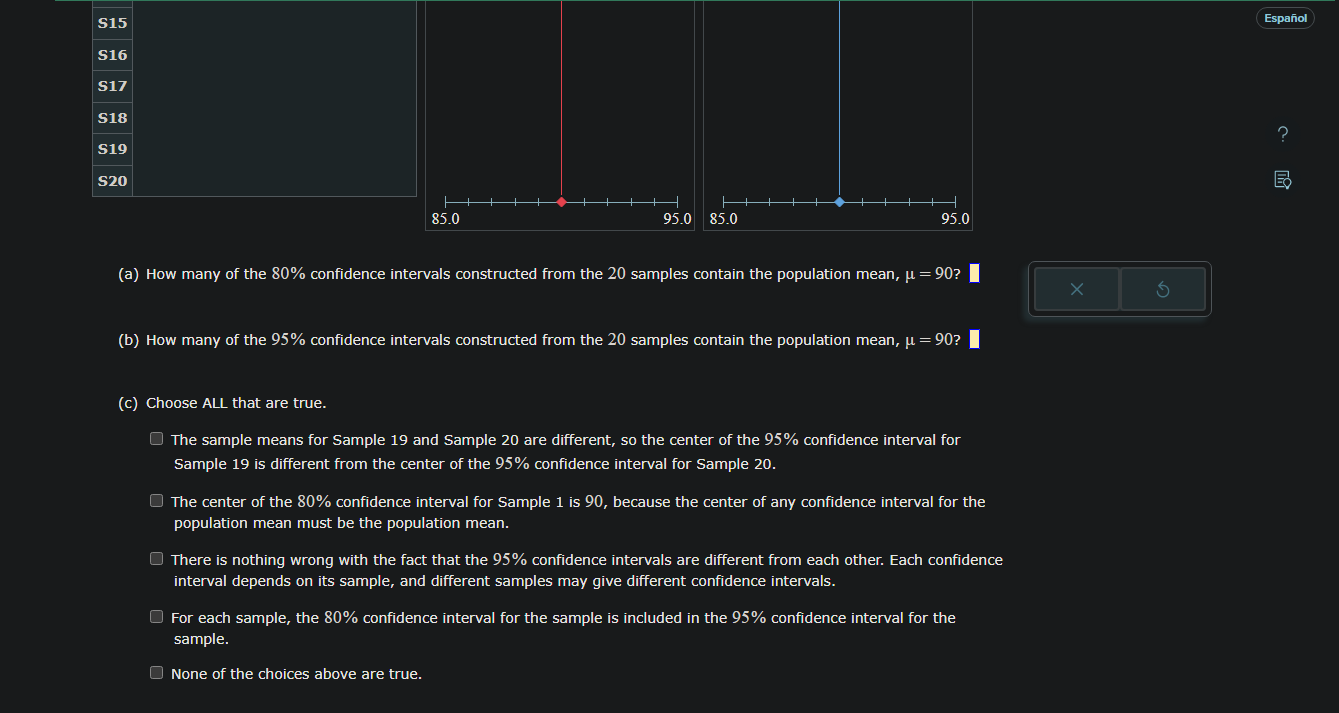
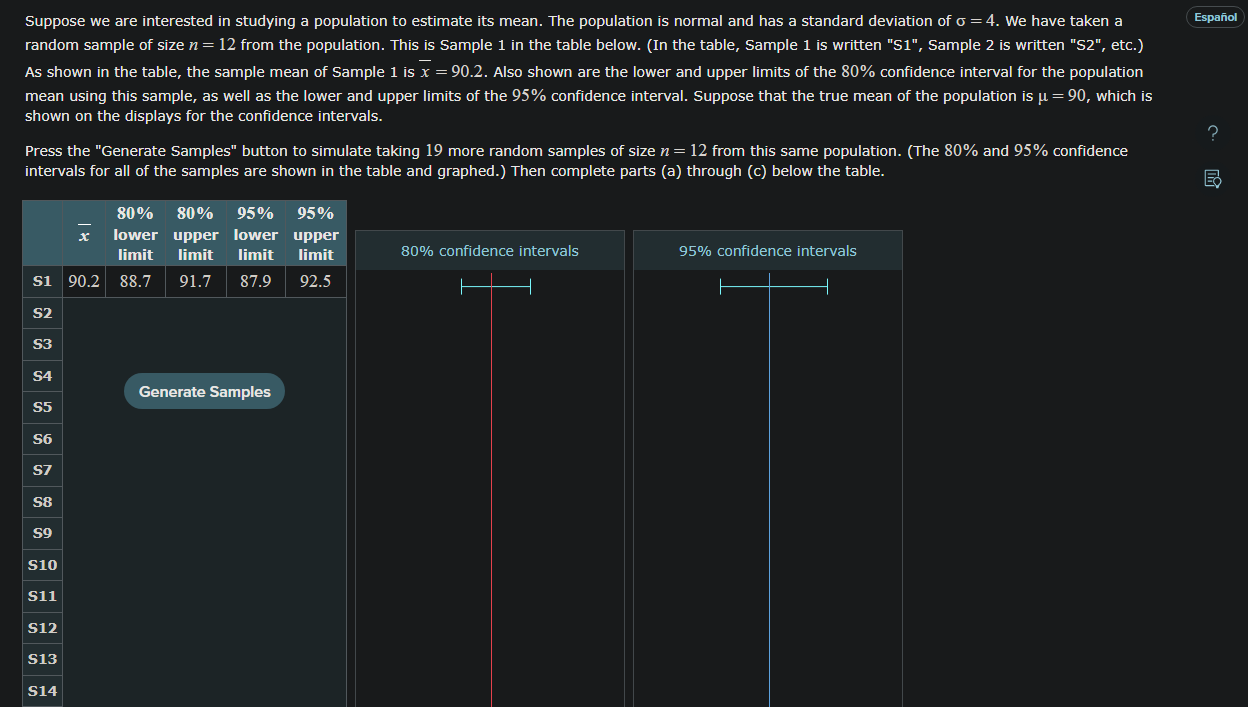
| 80% 80% 95% 95% lower upper lower upper limit limit limit limit S1 90.2 88.7 80% confidence intervals 95% confidence intervals 91.7 87.9 92.5 S2 88.9 87.4 90.4 86.6 91.2 S3 89.0 87.5 90.5 86.7 91.3 54 89.8 88.3 91.3 87.5 92.1 S5 92.0 90.5 93.5 89.7 94.3 S6 91.0 89.5 92.5 88.7 93.3 S7 89.4 87.9 90.9 87.1 91.7 S8 90.6 89.1 92.1 88.3 92.9 S9 89.9 88.4 91.4 87.6 92.2 $10 90.7 89.2 92.2 88.4 93.0 $11 91.1 89.6 92.6 88.8 93.4 S12 87.3 85.8 88.8 85.0 89.6 S13 89.2 87.7 90.7 86.9 91.5 S14 90.5 89.0 92.0 88.2 92.8 515 899 88.4 91.4 87.6 92.2 S16 90.9 89.4 92.4 88.6 93.2 S17 92.5 91.0 S18 88.9 87.4 $19 91.1 89.6 92.6 $20 89.9 88.4 91.4 94.0 90.2 90.4 86.6 91.2 94.8 88.8 93.4 87.6 92.2 85.0 95.0 85.0 95.0 S15 S16 S17 S18 S19 S20 85.0 95.0 85.0 95.0 (a) How many of the 80% confidence intervals constructed from the 20 samples contain the population mean, = 90? (b) How many of the 95% confidence intervals constructed from the 20 samples contain the population mean, = 90? (c) Choose ALL that are true. The sample means for Sample 19 and Sample 20 are different, so the center of the 95% confidence interval for Sample 19 is different from the center of the 95% confidence interval for Sample 20. The center of the 80% confidence interval for Sample 1 is 90, because the center of any confidence interval for the population mean must be the population mean. There is nothing wrong with the fact that the 95% confidence intervals are different from each other. Each confidence interval depends on its sample, and different samples may give different confidence intervals. For each sample, the 80% confidence interval for the sample is included in the 95% confidence interval for the sample. None of the choices above are true. Espaol ? I Suppose we are interested in studying a population to estimate its mean. The population is normal and has a standard deviation of = 4. We have taken a random sample of size n = 12 from the population. This is Sample 1 in the table below. (In the table, Sample 1 is written "S1", Sample 2 is written "S2", etc.) As shown in the table, the sample mean of Sample 1 is x = 90.2. Also shown are the lower and upper limits of the 80% confidence interval for the population mean using this sample, as well as the lower and upper limits of the 95% confidence interval. Suppose that the true mean of the population is = 90, which is shown on the displays for the confidence intervals. Press the "Generate Samples" button to simulate taking 19 more random samples of size n = 12 from this same population. (The 80% and 95% confidence intervals for all of the samples are shown in the table and graphed.) Then complete parts (a) through (c) below the table. Espaol ? Ex x 80% 80% 95% 95% lower upper lower upper limit limit limit limit S1 90.2 88.7 91.7 87.9 92.5 80% confidence intervals 95% confidence intervals S2 S3 S4 Generate Samples S5 S6 S7 S8 S9 S10 S11 S12 S13 S14
Step by Step Solution
There are 3 Steps involved in it

Get step-by-step solutions from verified subject matter experts