

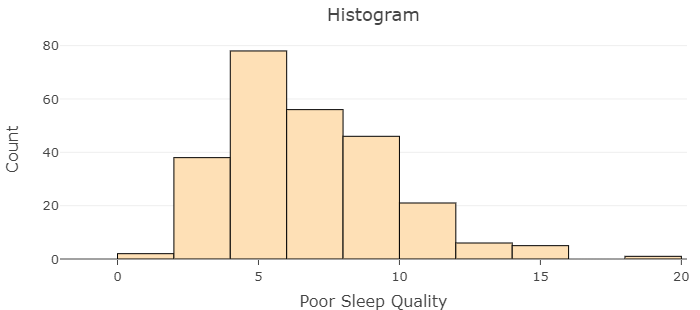
Question: 80 Histogram 60 60 Count 40 40 20 20 0 T 5 10 Poor Sleep Quality 15 20
80 Histogram 60 60 Count 40 40 20 20 0 T 5 10 Poor Sleep Quality 15 20
Step by Step Solution
There are 3 Steps involved in it
1 Expert Approved Answer
Step: 1 Unlock

Question Has Been Solved by an Expert!
Get step-by-step solutions from verified subject matter experts
Step: 2 Unlock
Step: 3 Unlock