Question: >>>>>>>>>>>>> Please compute the answer with no software step by step ========================================================================= use the information from below to answer question 3 worker= 1/ men 2/
>>>>>>>>>>>>> Please compute the answer with no software step by step
=========================================================================
use the information from below to answer question 3
worker= 1/ men 2/ women
question 3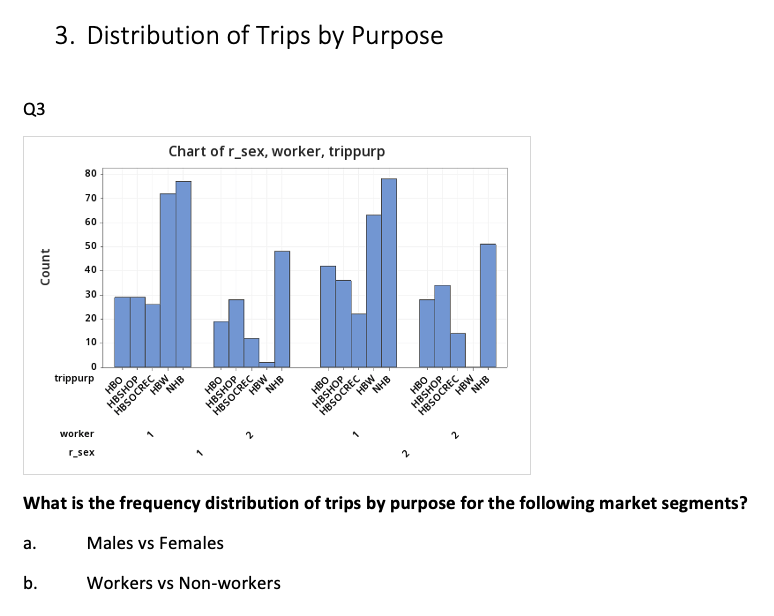
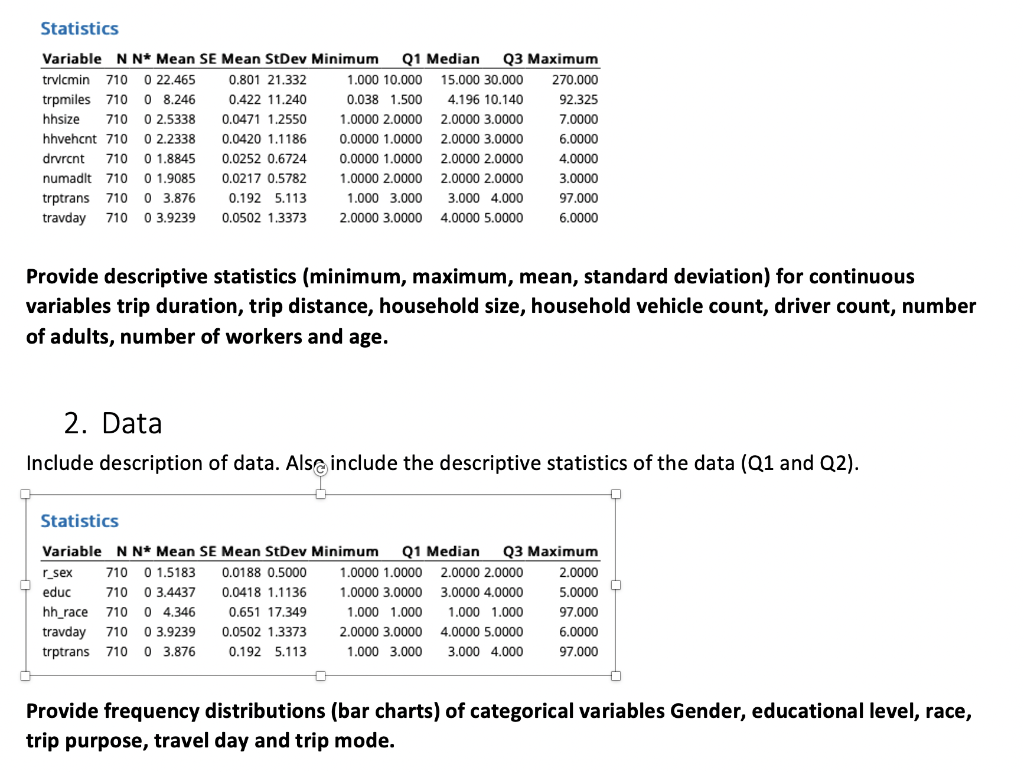
Statistics Variable NN* Mean SE Mean StDev Minimum Q1 Median Q3 Maximum trvlcmin 710 0 22.465 0.801 21.332 1.000 10.000 15.000 30.000 270.000 trpmiles 710 0 8.246 0.422 11.240 0.038 1.500 4.196 10.140 92.325 hhsize 710 0 2.5338 0.0471 1.2550 1.0000 2.0000 2.0000 3.0000 7.0000 hhvehcnt 710 0 2.2338 0.0420 1.1186 0.0000 1.0000 2.0000 3.0000 6.0000 drvrent 710 0 1.8845 0.0252 0.6724 0.0000 1.0000 2.0000 2.0000 4.0000 numadit 710 0 1.9085 0.0217 0.5782 1.0000 2.0000 2.0000 2.0000 3.0000 trptrans 710 03.876 0.192 5.113 1.000 3.000 3.000 4.000 97.000 travday 710 03.9239 0.0502 1.3373 2.0000 3.0000 4.0000 5.0000 6.0000 Provide descriptive statistics (minimum, maximum, mean, standard deviation) for continuous variables trip duration, trip distance, household size, household vehicle count, driver count, number of adults, number of workers and age. 2. Data Include description of data. Also include the descriptive statistics of the data (Q1 and Q2). Statistics Variable N N* Mean SE Mean StDev Minimum Q1 Median Q3 Maximum r_sex 710 0 1.5183 0.0188 0.5000 1.0000 1.0000 2.0000 2.0000 2.0000 educ 710 0 3.4437 0.0418 1.1136 1.0000 3.0000 3.0000 4.0000 5.0000 hh_race 710 0 4.346 0.651 17.349 1.000 1.000 1.000 1.000 97.000 travday 710 0 3.9239 0.0502 1.3373 2.0000 3.0000 4.0000 5.0000 6.0000 trptrans 710 0 3.876 0.192 5.113 1.000 3.000 3.000 4.000 97.000 Provide frequency distributions (bar charts) of categorical variables Gender, educational level, race, trip purpose, travel day and trip mode. COH 3. Distribution of Trips by Purpose Q3 Chart of r_sex, worker, trippurp 80 70 60 50 Count 40 30 20 1 10 0 trippurp BHN SHOP HEW POSSO # BHN HBSOCE HBW HBSOCREC HBSHOP HBSHOP HESOCREC HBW worker 2 2 r_sex What is the frequency distribution of trips by purpose for the following market segments? a. Males vs Females a. b. Workers vs Non-workers Statistics Variable NN* Mean SE Mean StDev Minimum Q1 Median Q3 Maximum trvlcmin 710 0 22.465 0.801 21.332 1.000 10.000 15.000 30.000 270.000 trpmiles 710 0 8.246 0.422 11.240 0.038 1.500 4.196 10.140 92.325 hhsize 710 0 2.5338 0.0471 1.2550 1.0000 2.0000 2.0000 3.0000 7.0000 hhvehcnt 710 0 2.2338 0.0420 1.1186 0.0000 1.0000 2.0000 3.0000 6.0000 drvrent 710 0 1.8845 0.0252 0.6724 0.0000 1.0000 2.0000 2.0000 4.0000 numadit 710 0 1.9085 0.0217 0.5782 1.0000 2.0000 2.0000 2.0000 3.0000 trptrans 710 03.876 0.192 5.113 1.000 3.000 3.000 4.000 97.000 travday 710 03.9239 0.0502 1.3373 2.0000 3.0000 4.0000 5.0000 6.0000 Provide descriptive statistics (minimum, maximum, mean, standard deviation) for continuous variables trip duration, trip distance, household size, household vehicle count, driver count, number of adults, number of workers and age. 2. Data Include description of data. Also include the descriptive statistics of the data (Q1 and Q2). Statistics Variable N N* Mean SE Mean StDev Minimum Q1 Median Q3 Maximum r_sex 710 0 1.5183 0.0188 0.5000 1.0000 1.0000 2.0000 2.0000 2.0000 educ 710 0 3.4437 0.0418 1.1136 1.0000 3.0000 3.0000 4.0000 5.0000 hh_race 710 0 4.346 0.651 17.349 1.000 1.000 1.000 1.000 97.000 travday 710 0 3.9239 0.0502 1.3373 2.0000 3.0000 4.0000 5.0000 6.0000 trptrans 710 0 3.876 0.192 5.113 1.000 3.000 3.000 4.000 97.000 Provide frequency distributions (bar charts) of categorical variables Gender, educational level, race, trip purpose, travel day and trip mode. COH 3. Distribution of Trips by Purpose Q3 Chart of r_sex, worker, trippurp 80 70 60 50 Count 40 30 20 1 10 0 trippurp BHN SHOP HEW POSSO # BHN HBSOCE HBW HBSOCREC HBSHOP HBSHOP HESOCREC HBW worker 2 2 r_sex What is the frequency distribution of trips by purpose for the following market segments? a. Males vs Females a. b. Workers vs Non-workers


