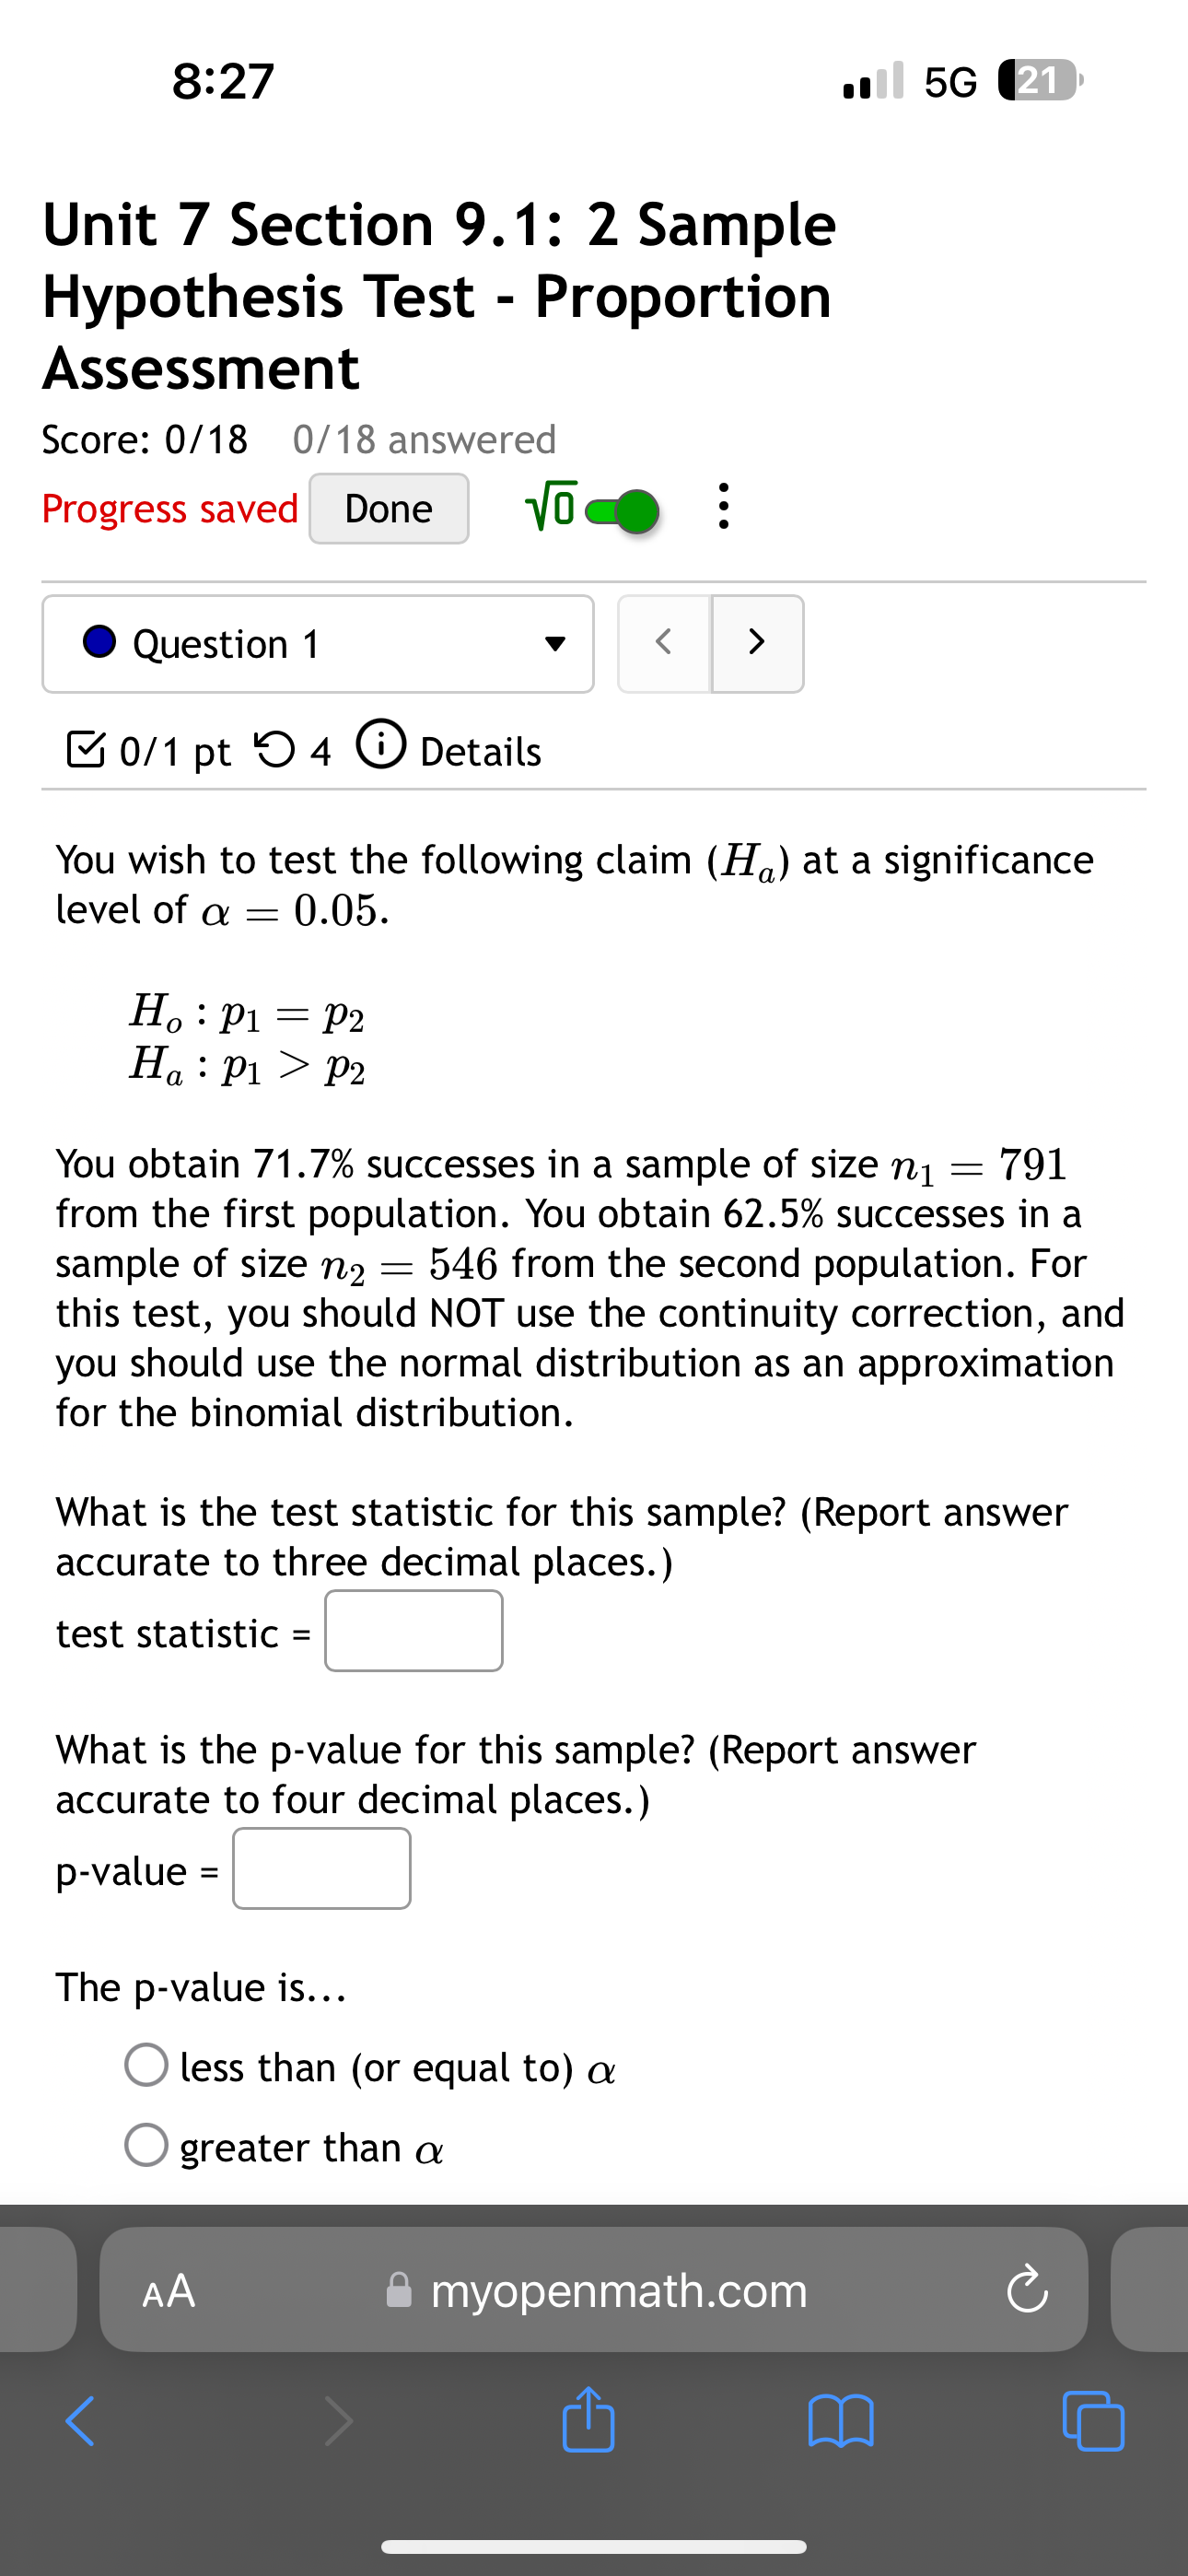
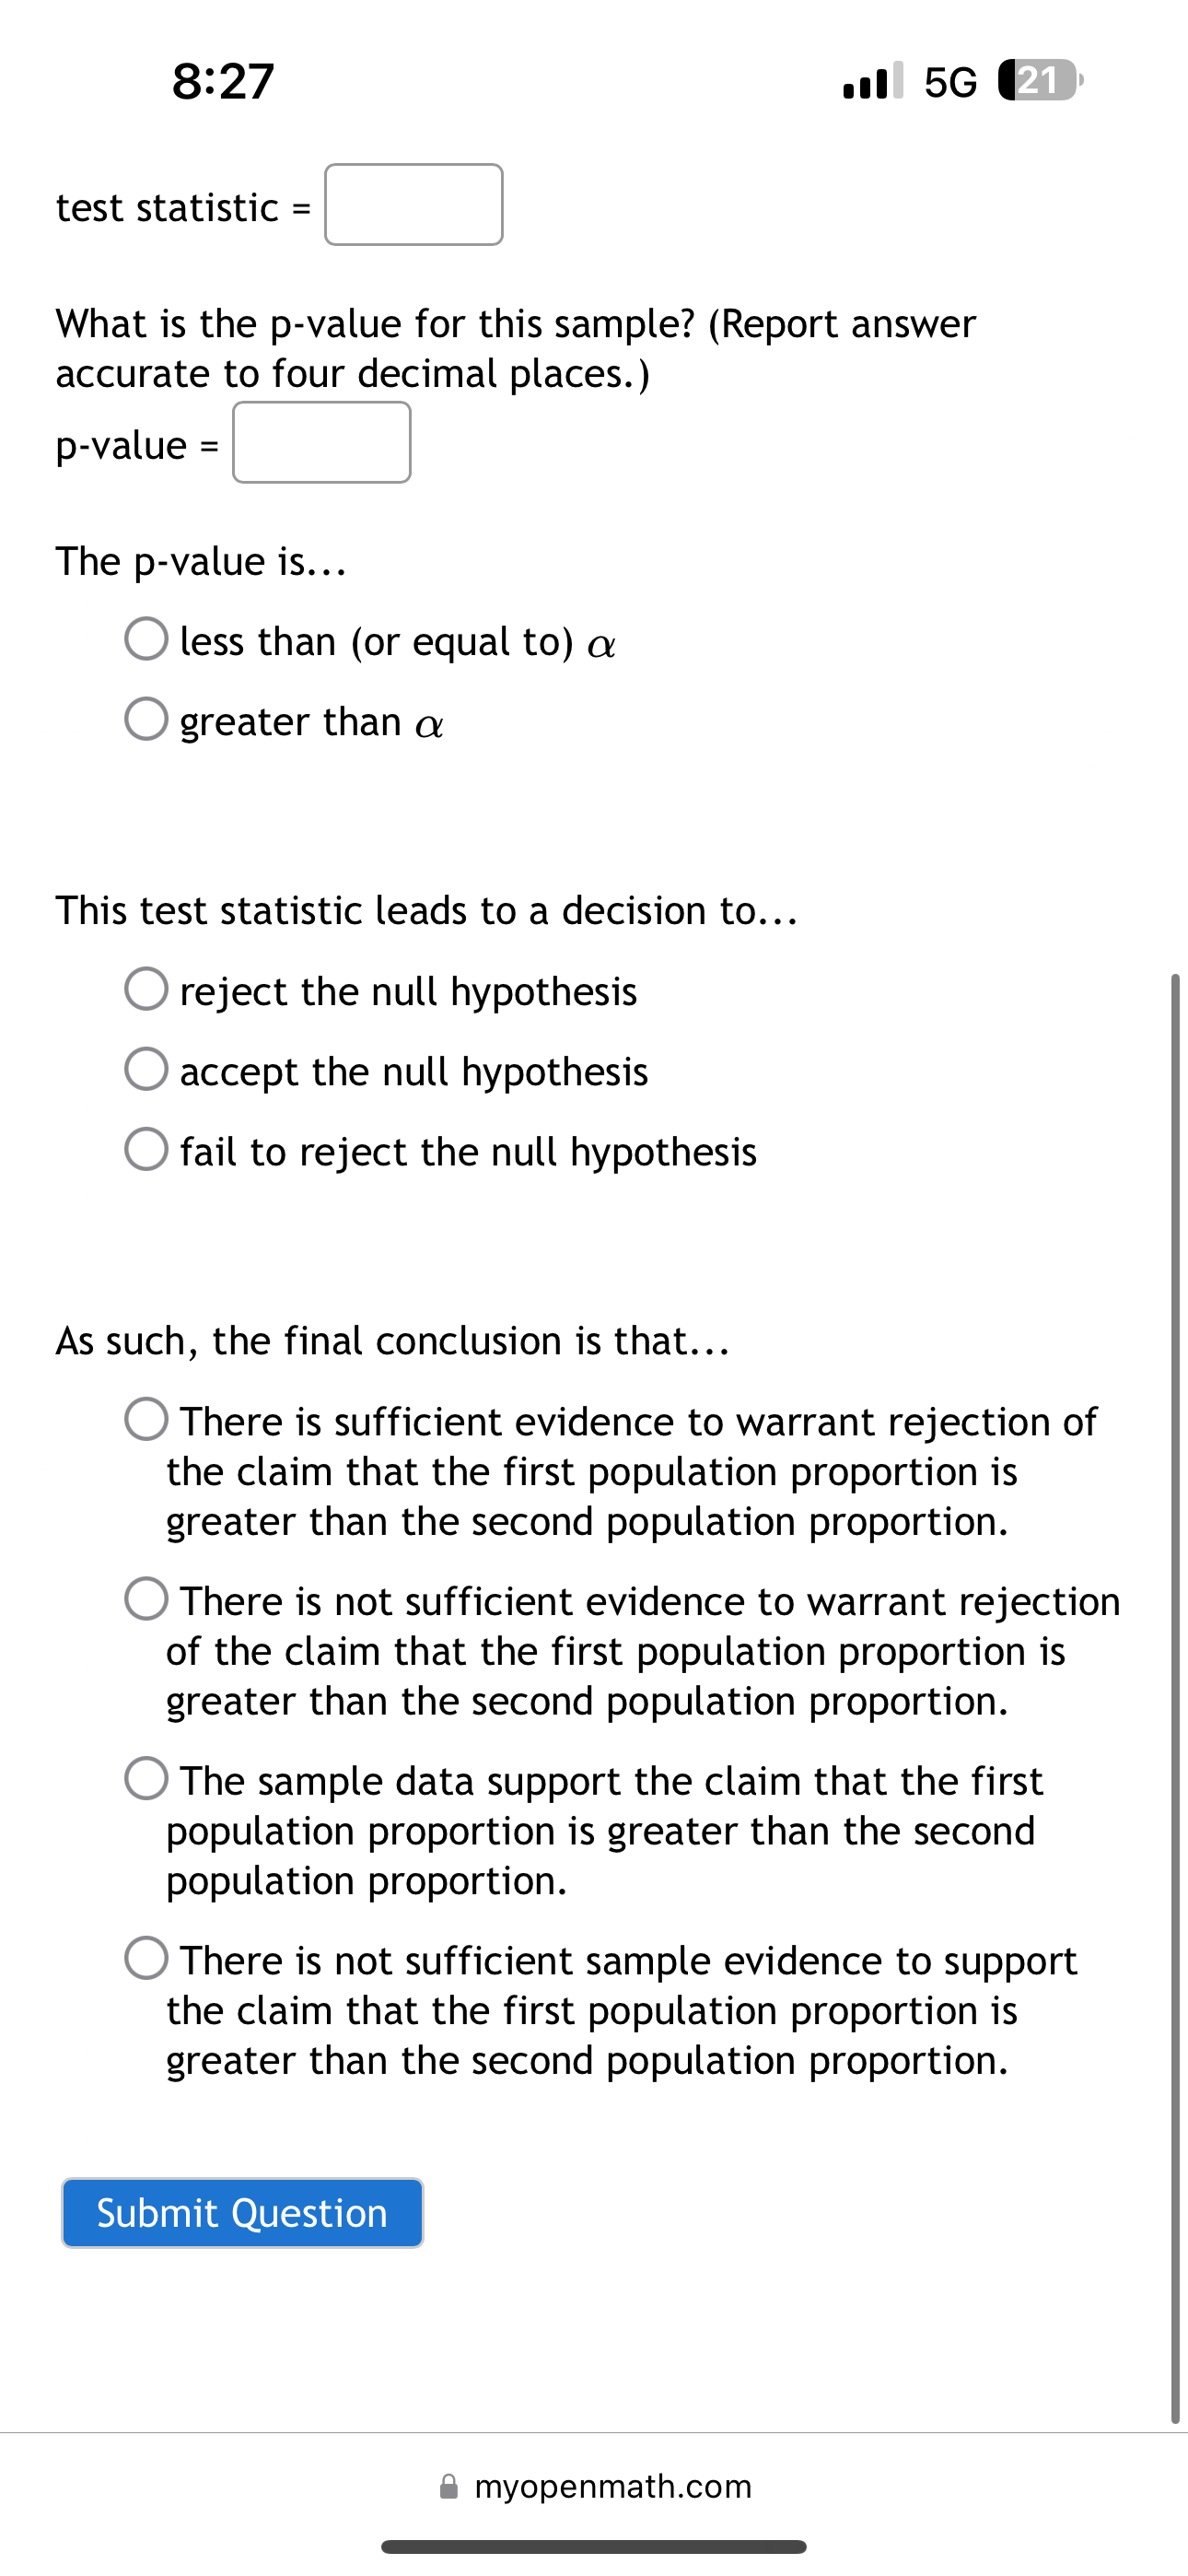
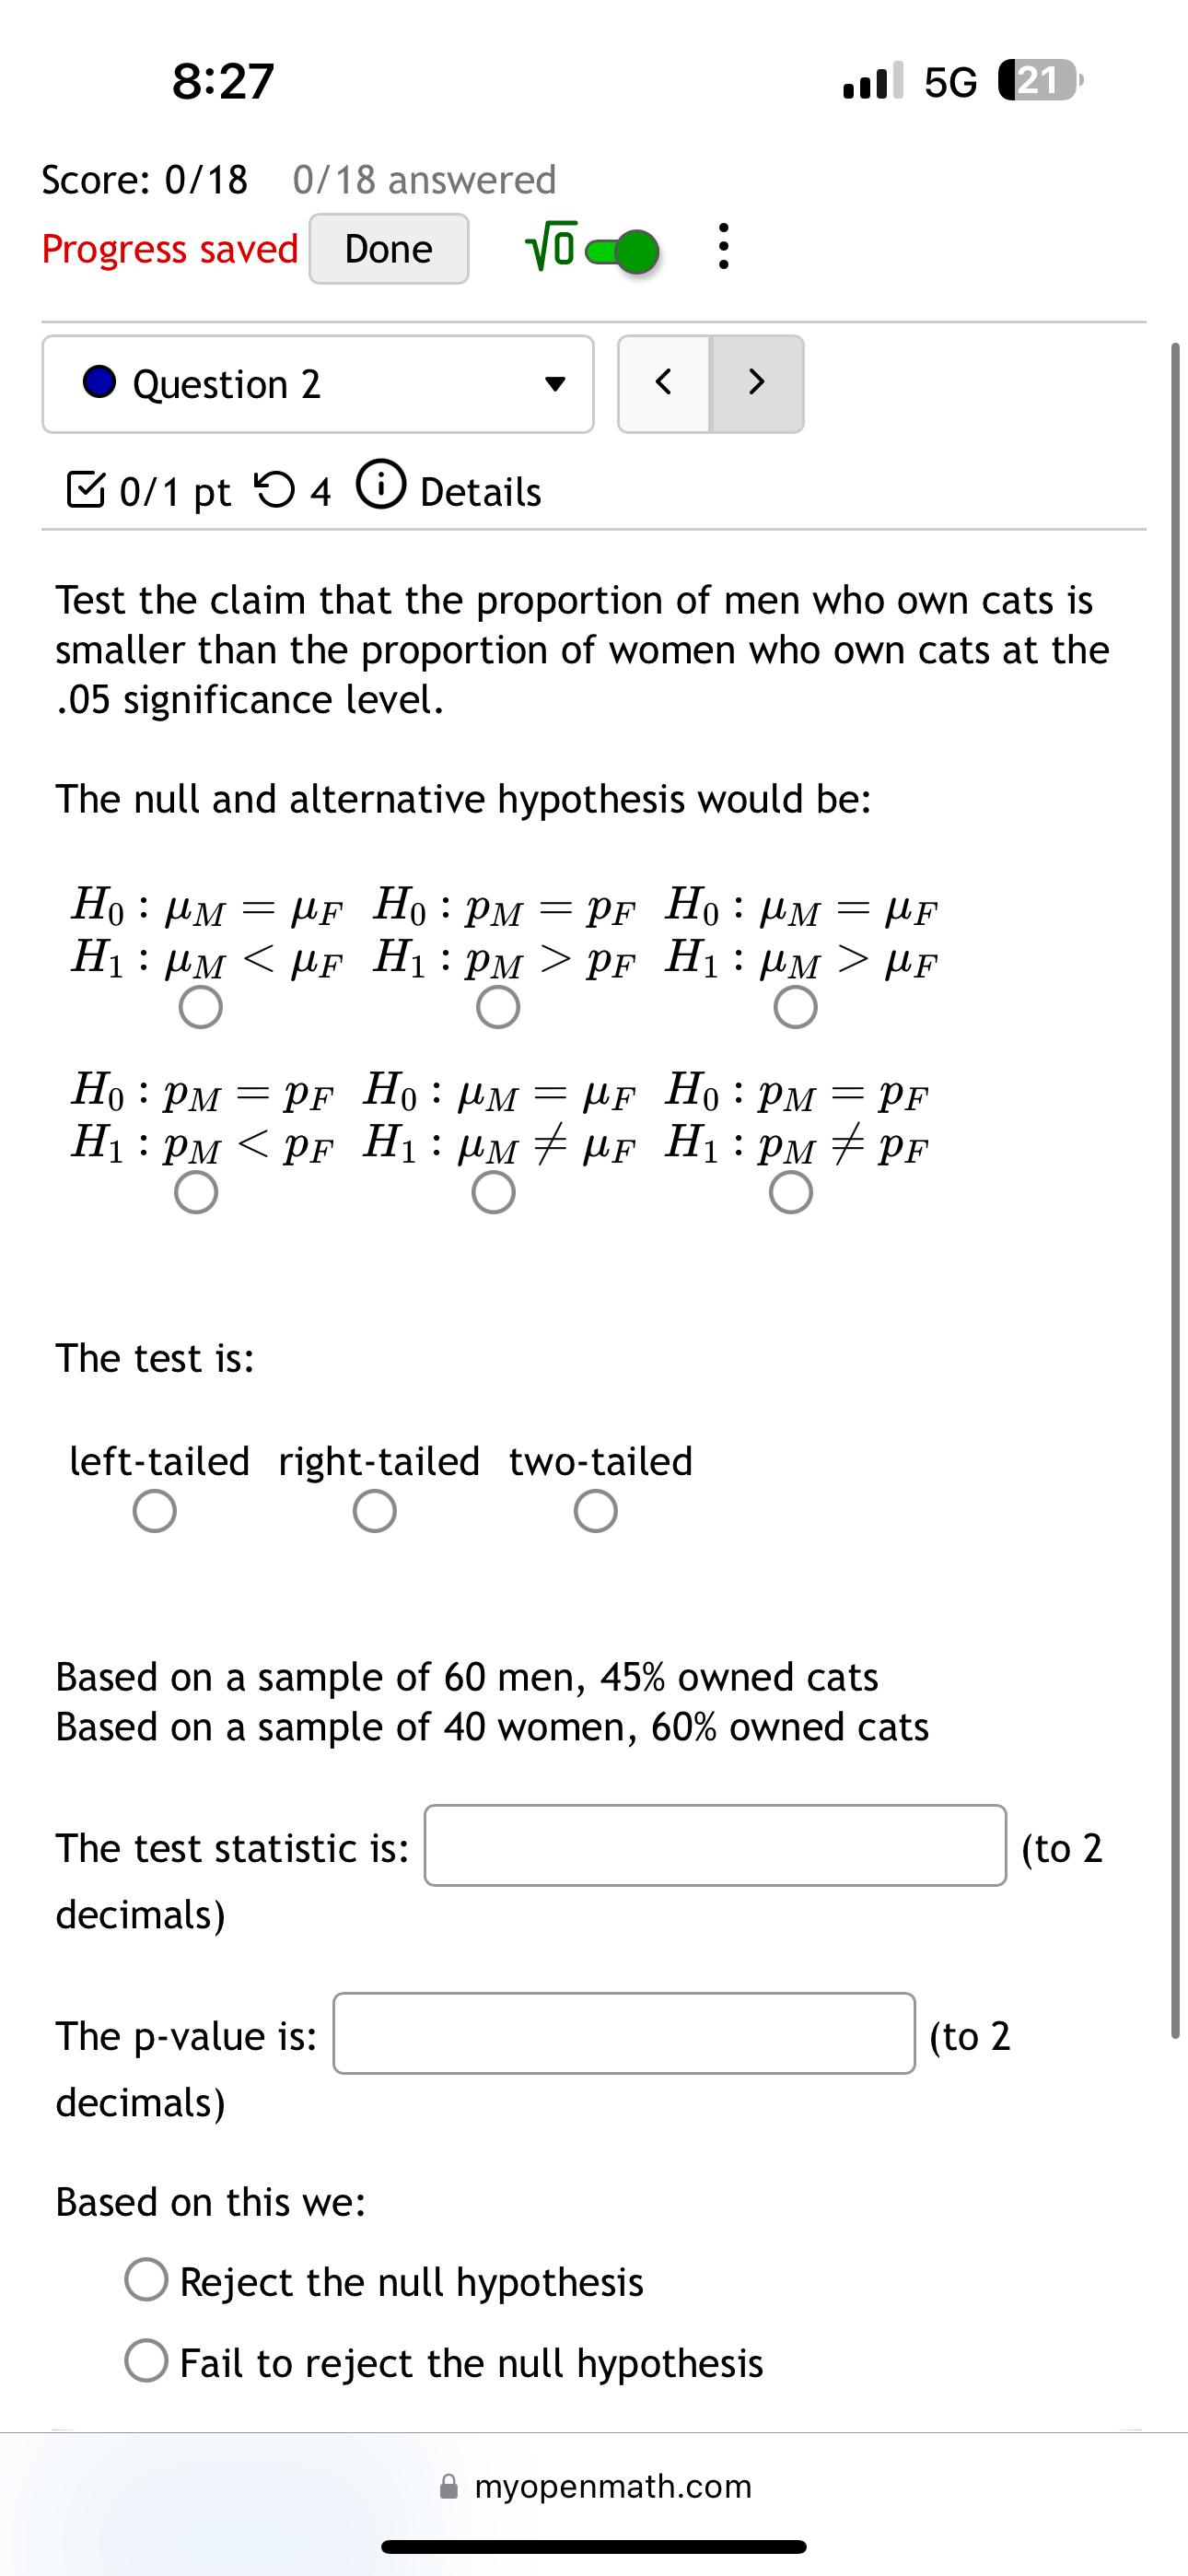
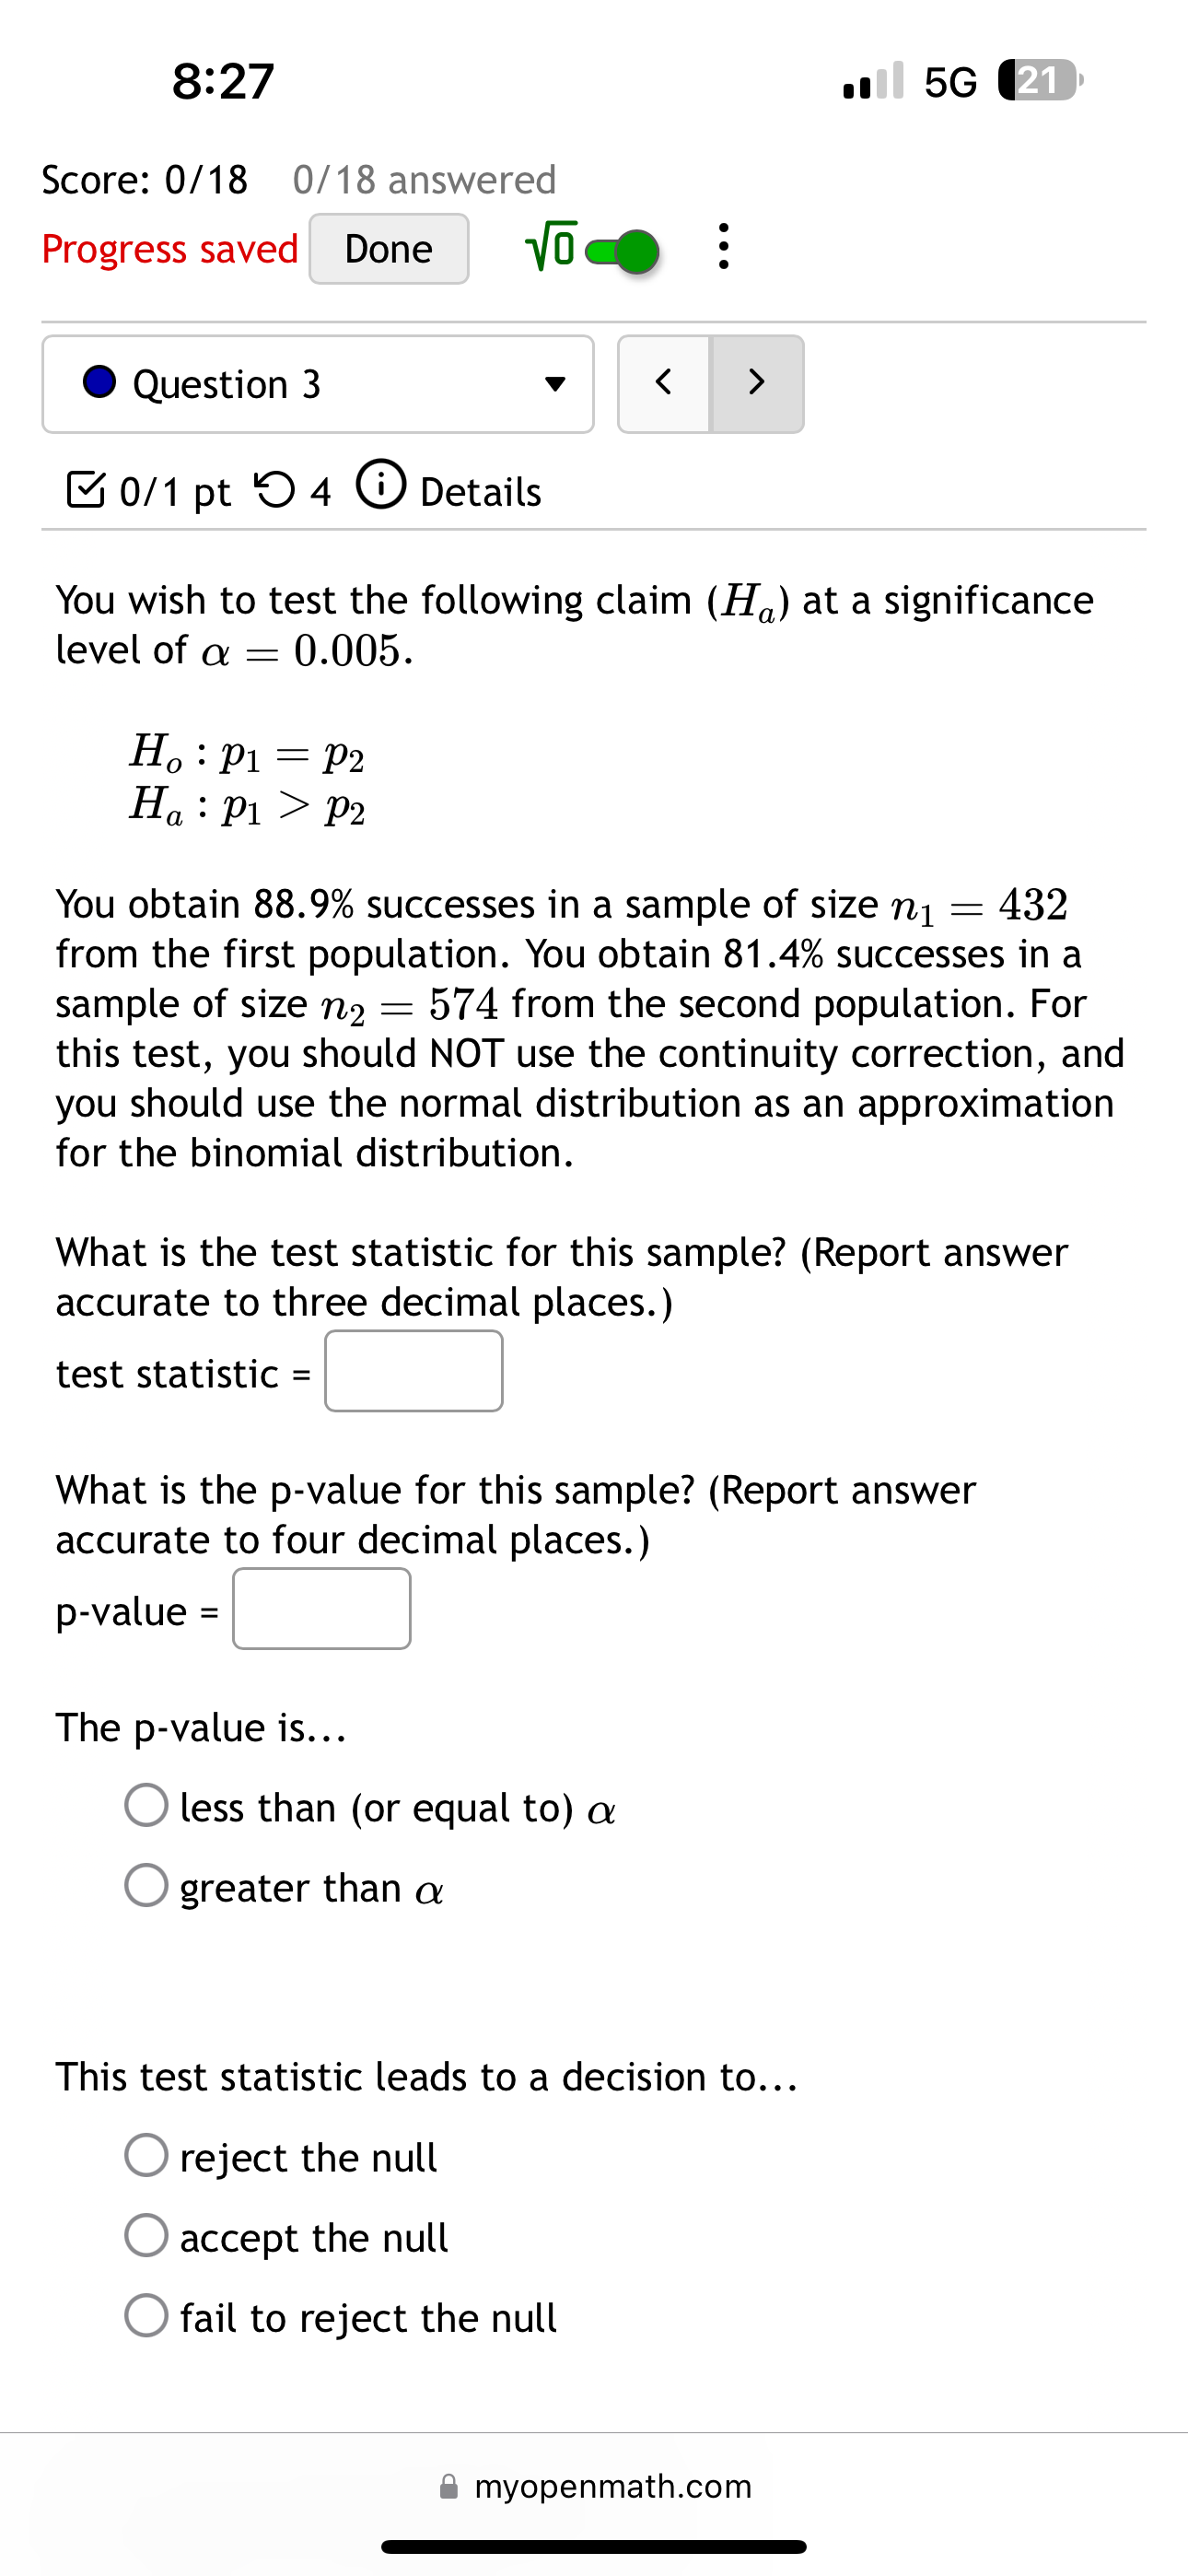
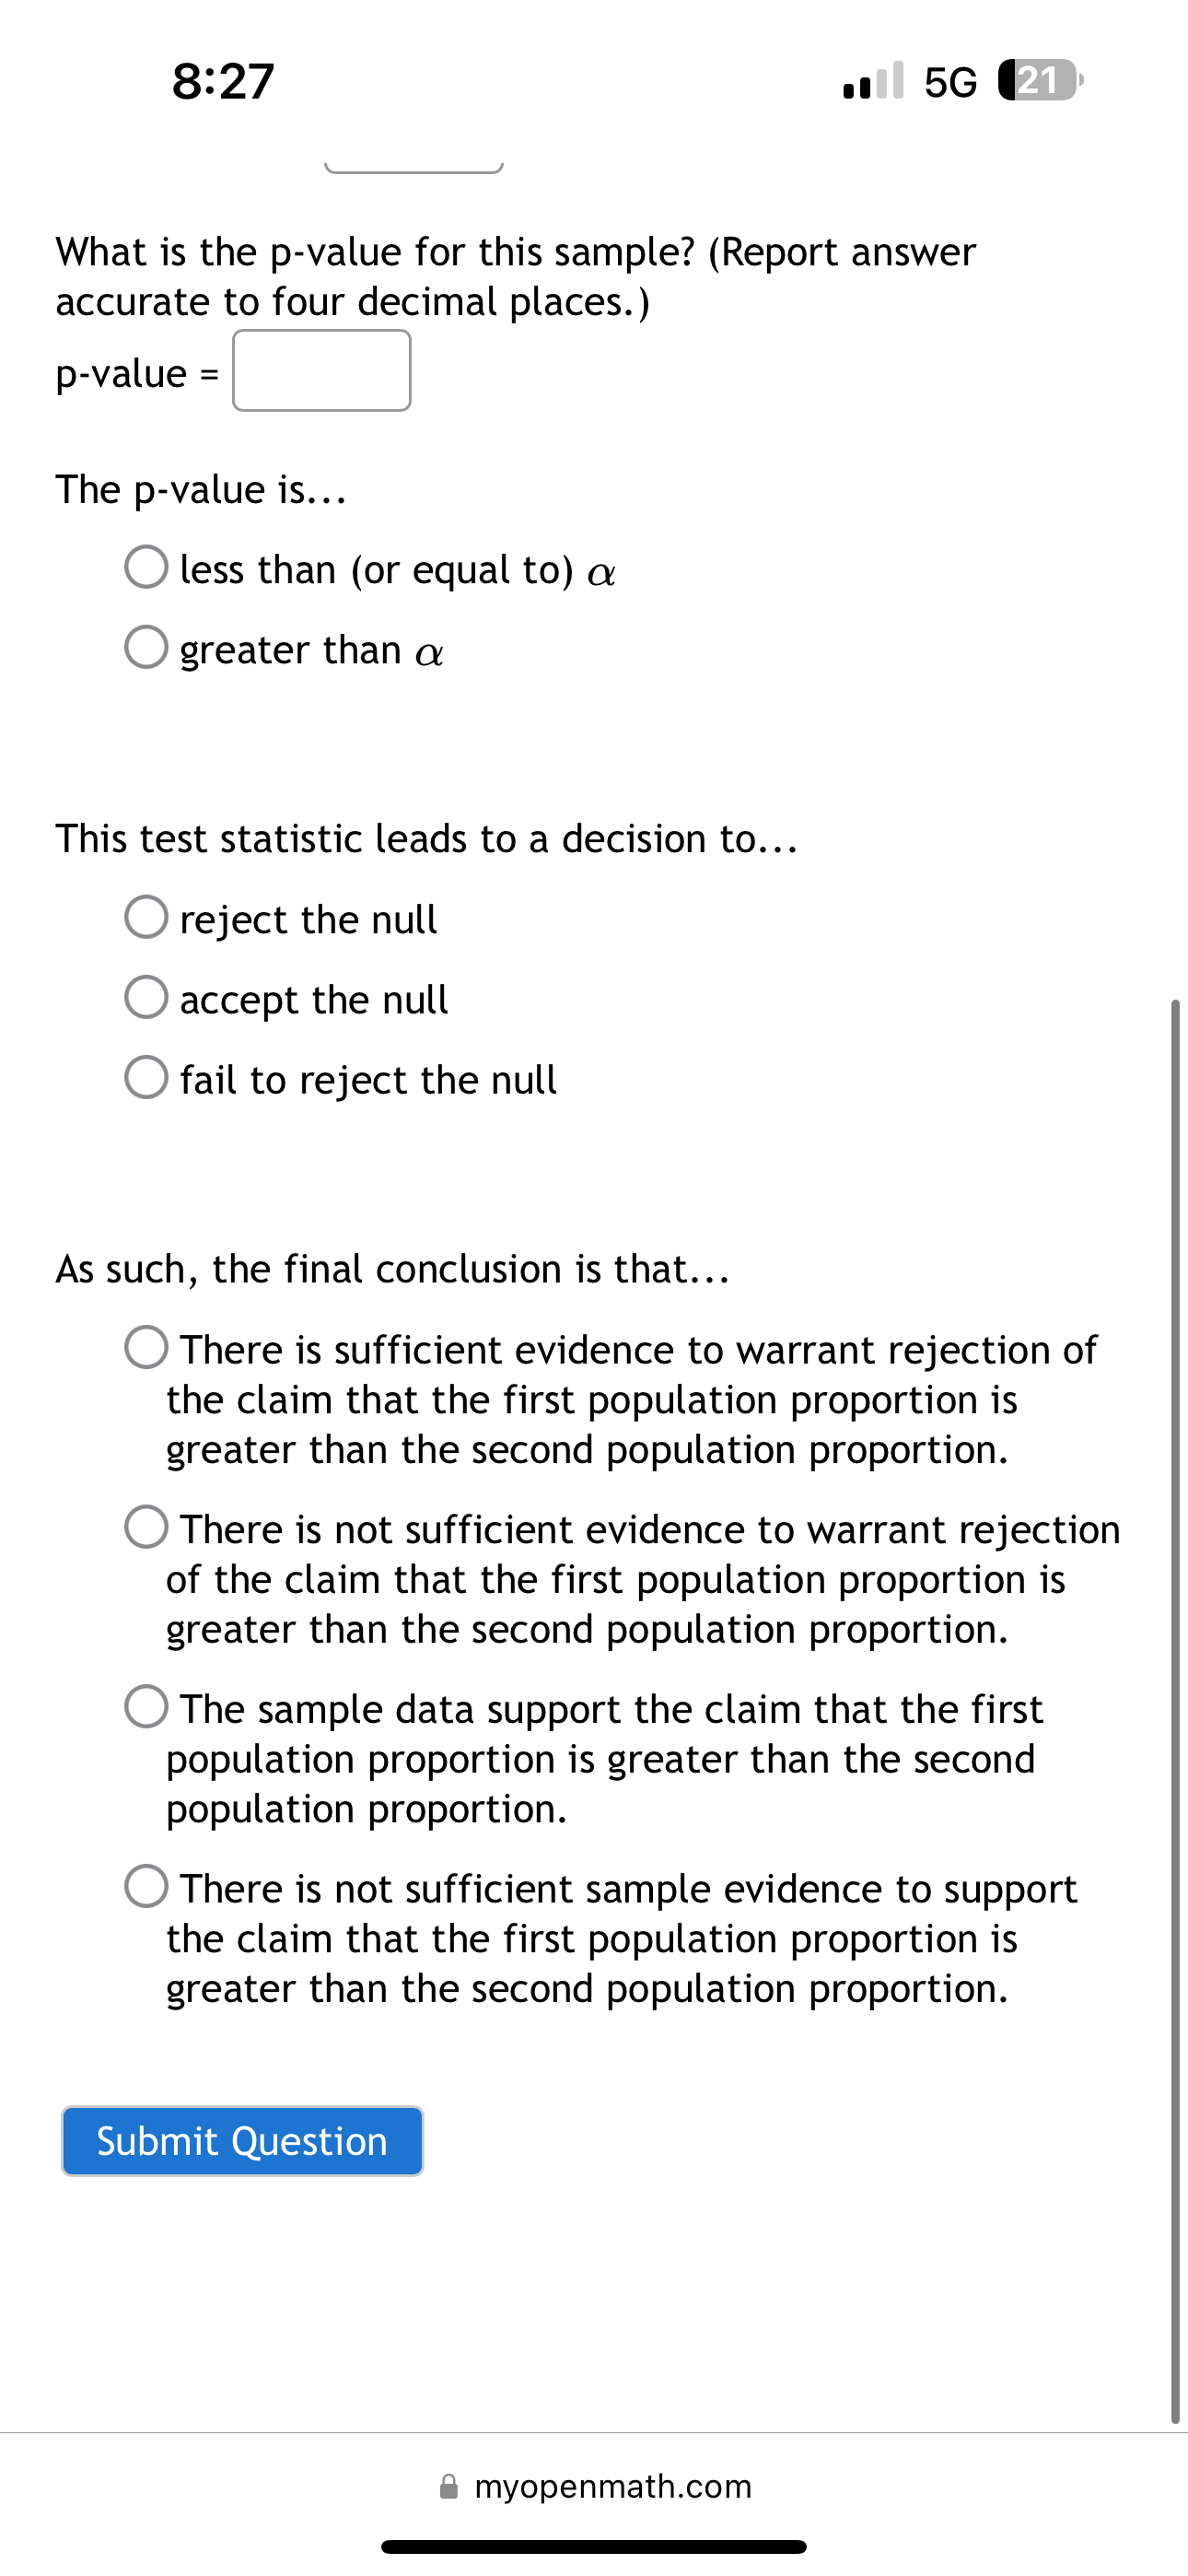
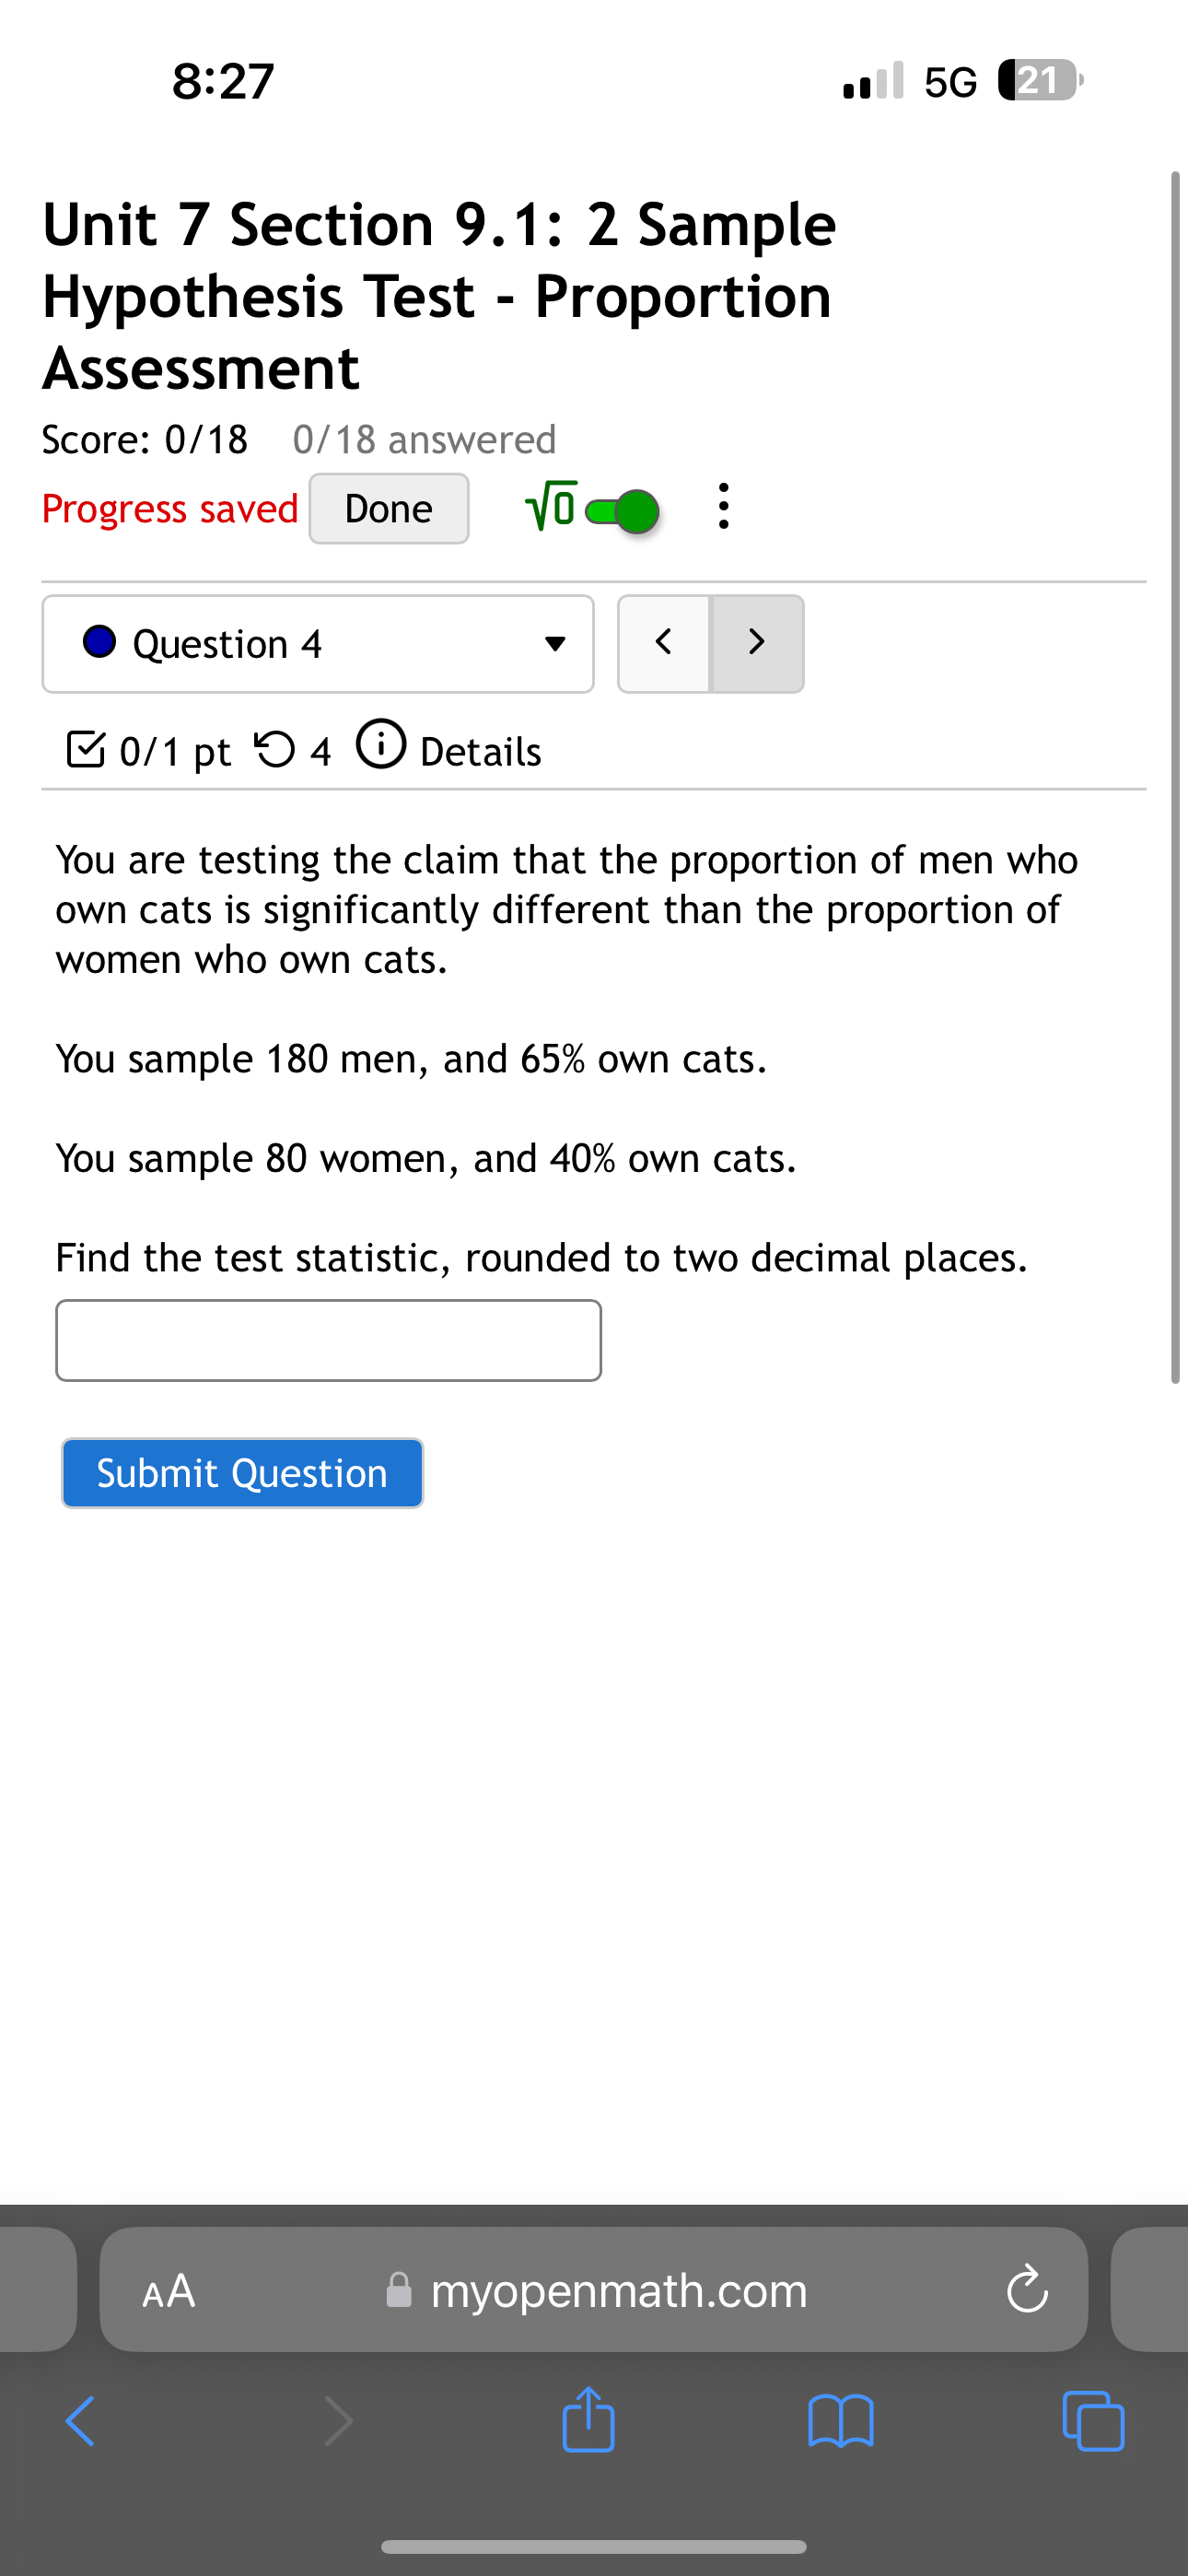
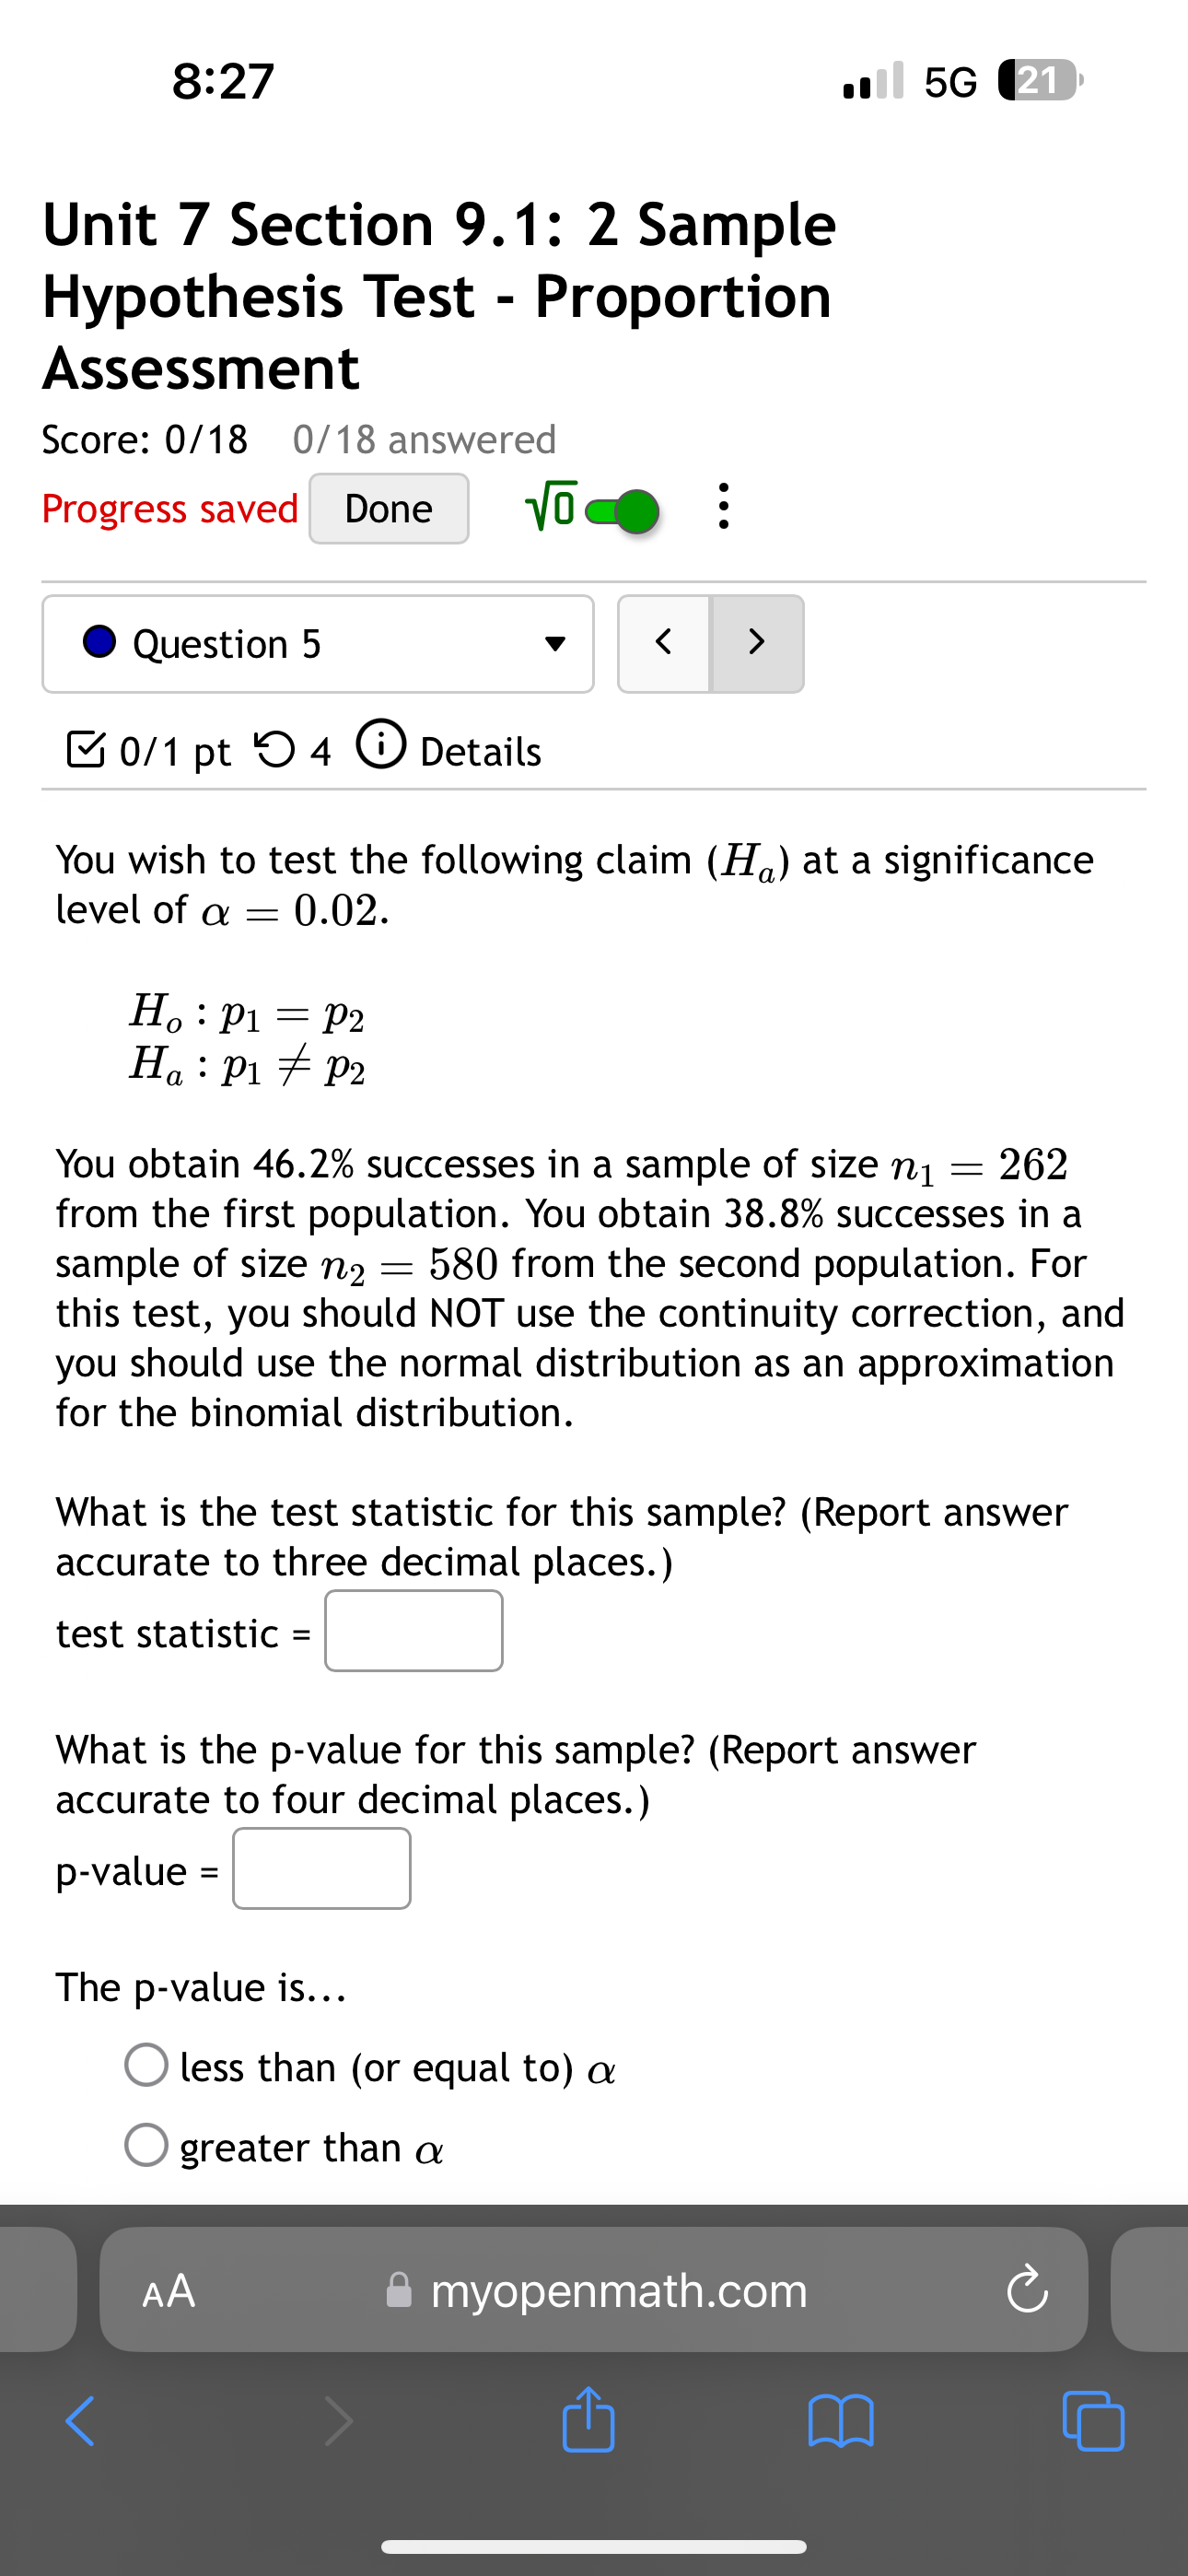
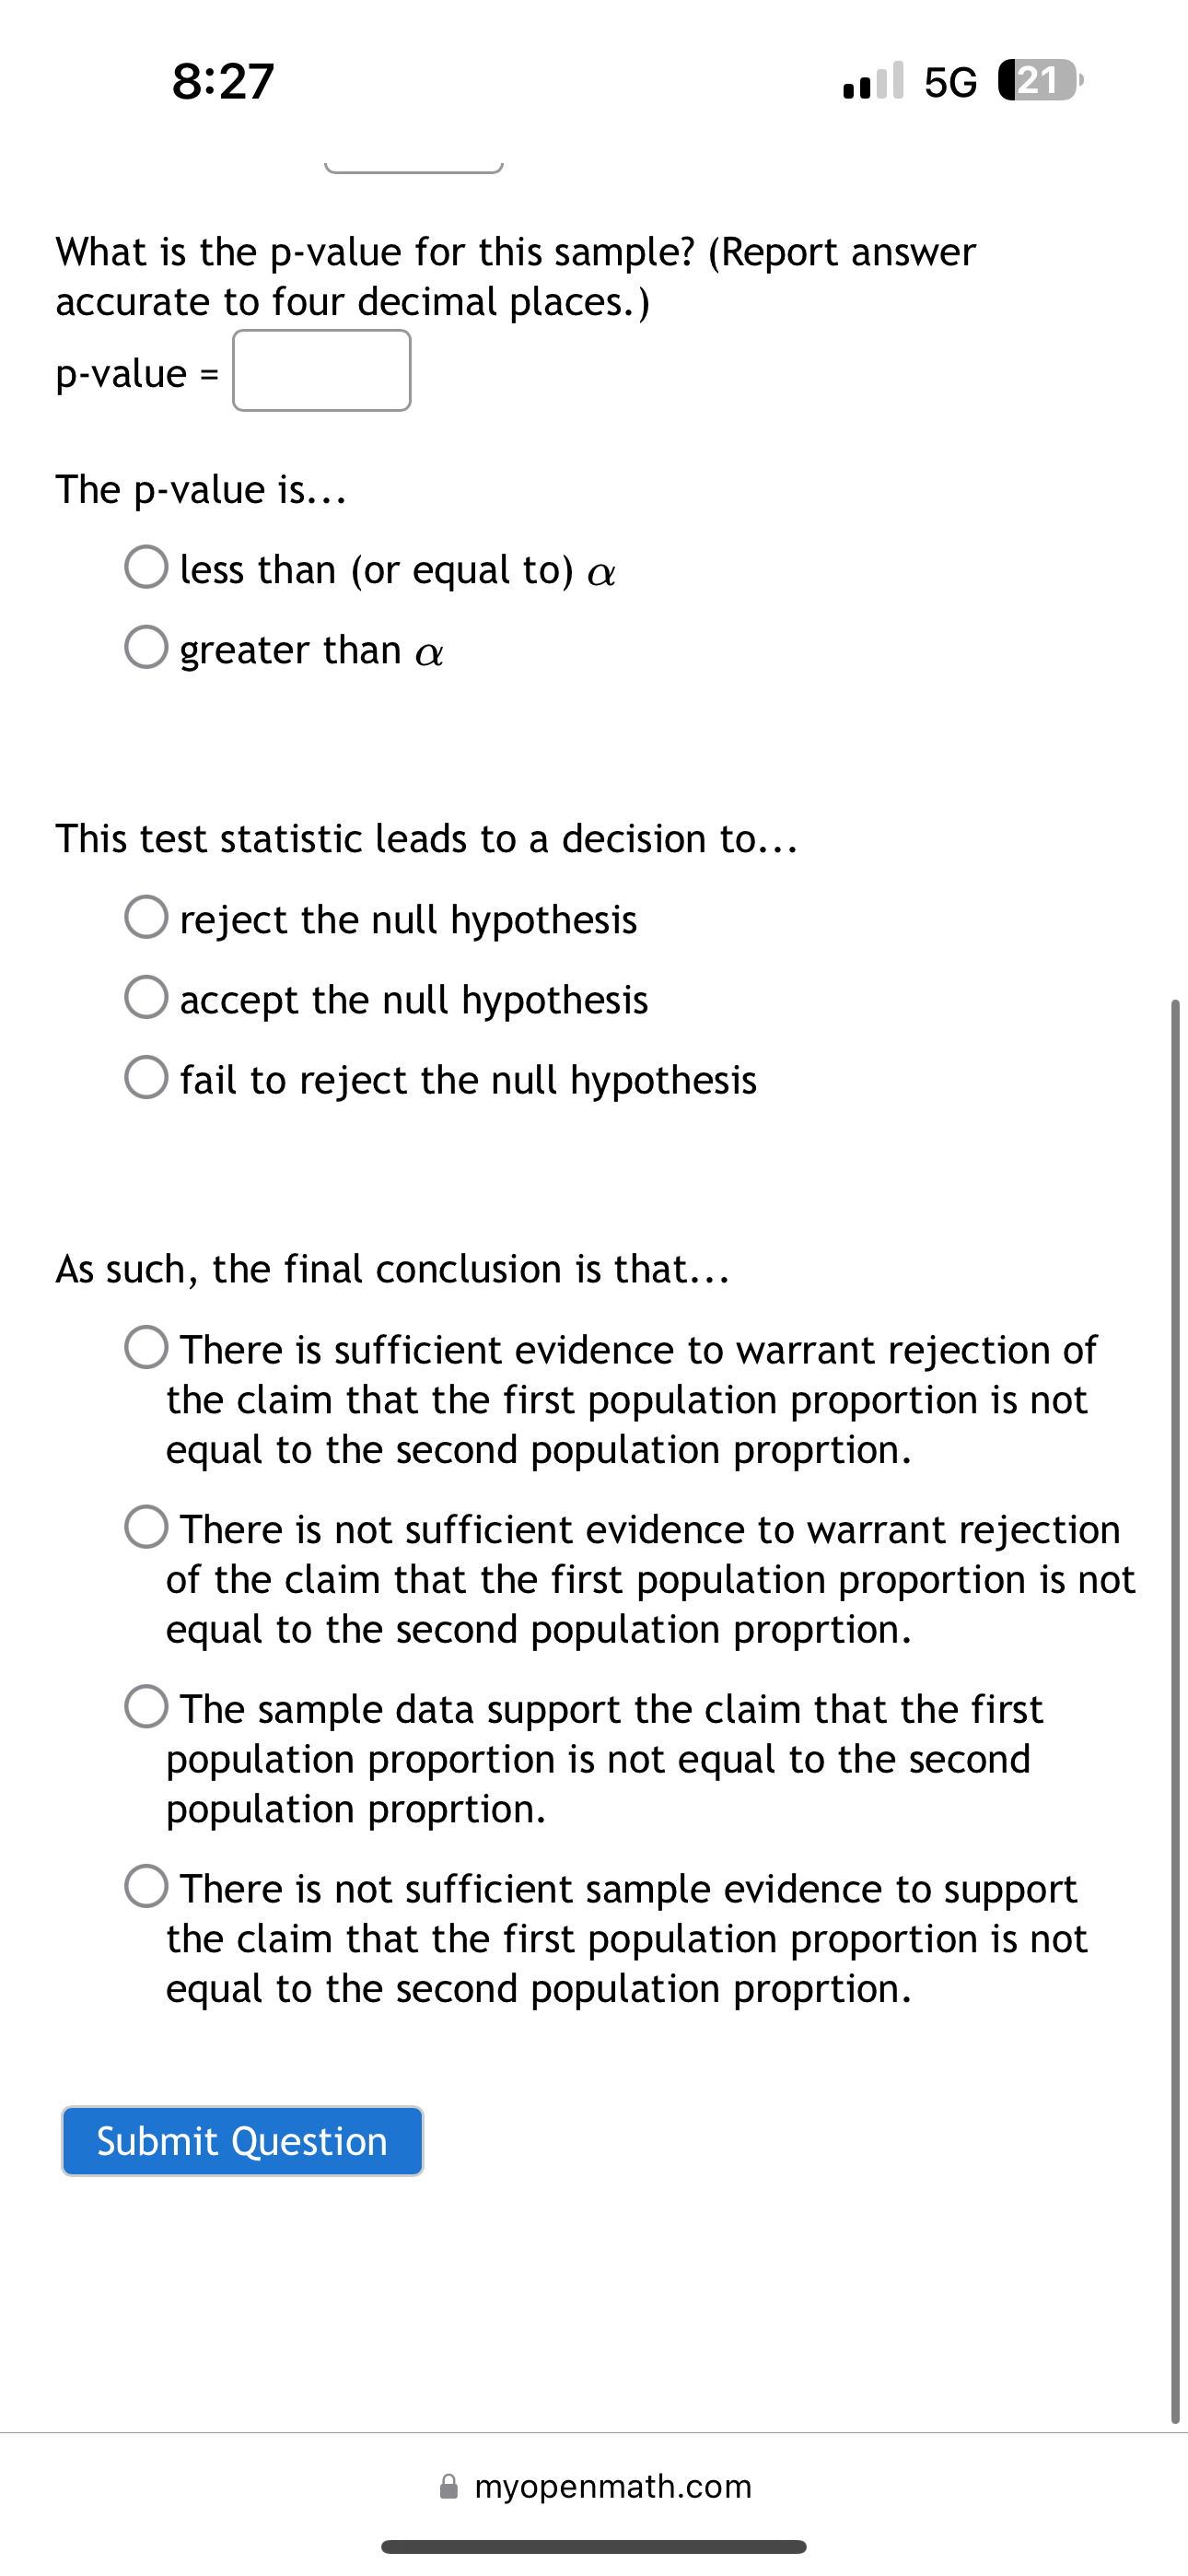
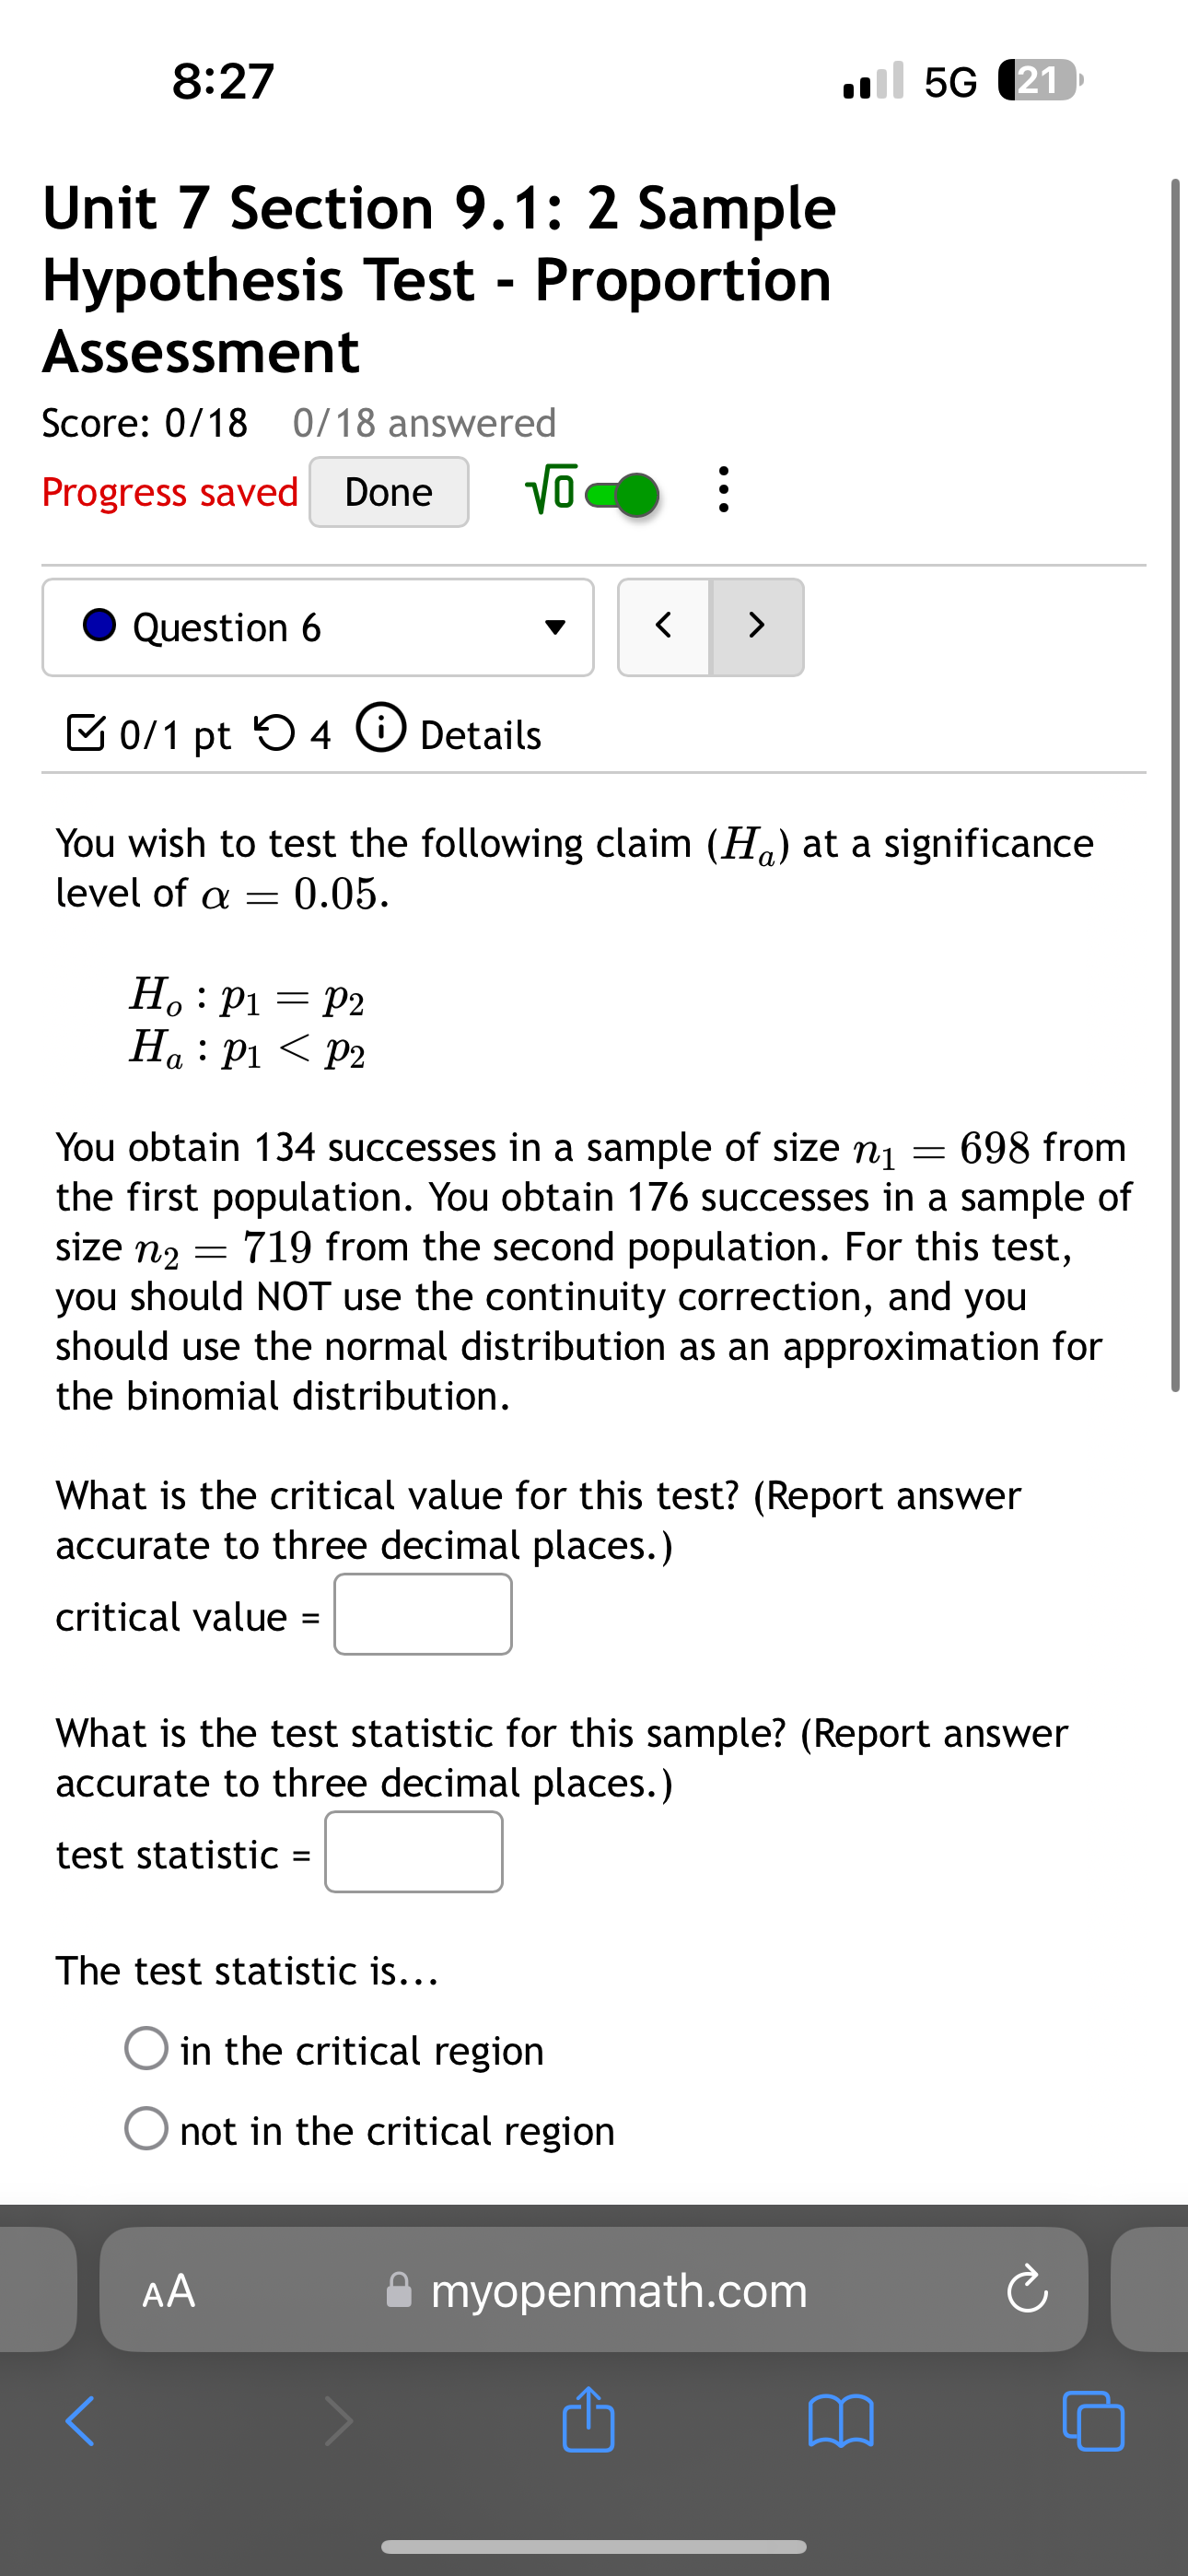
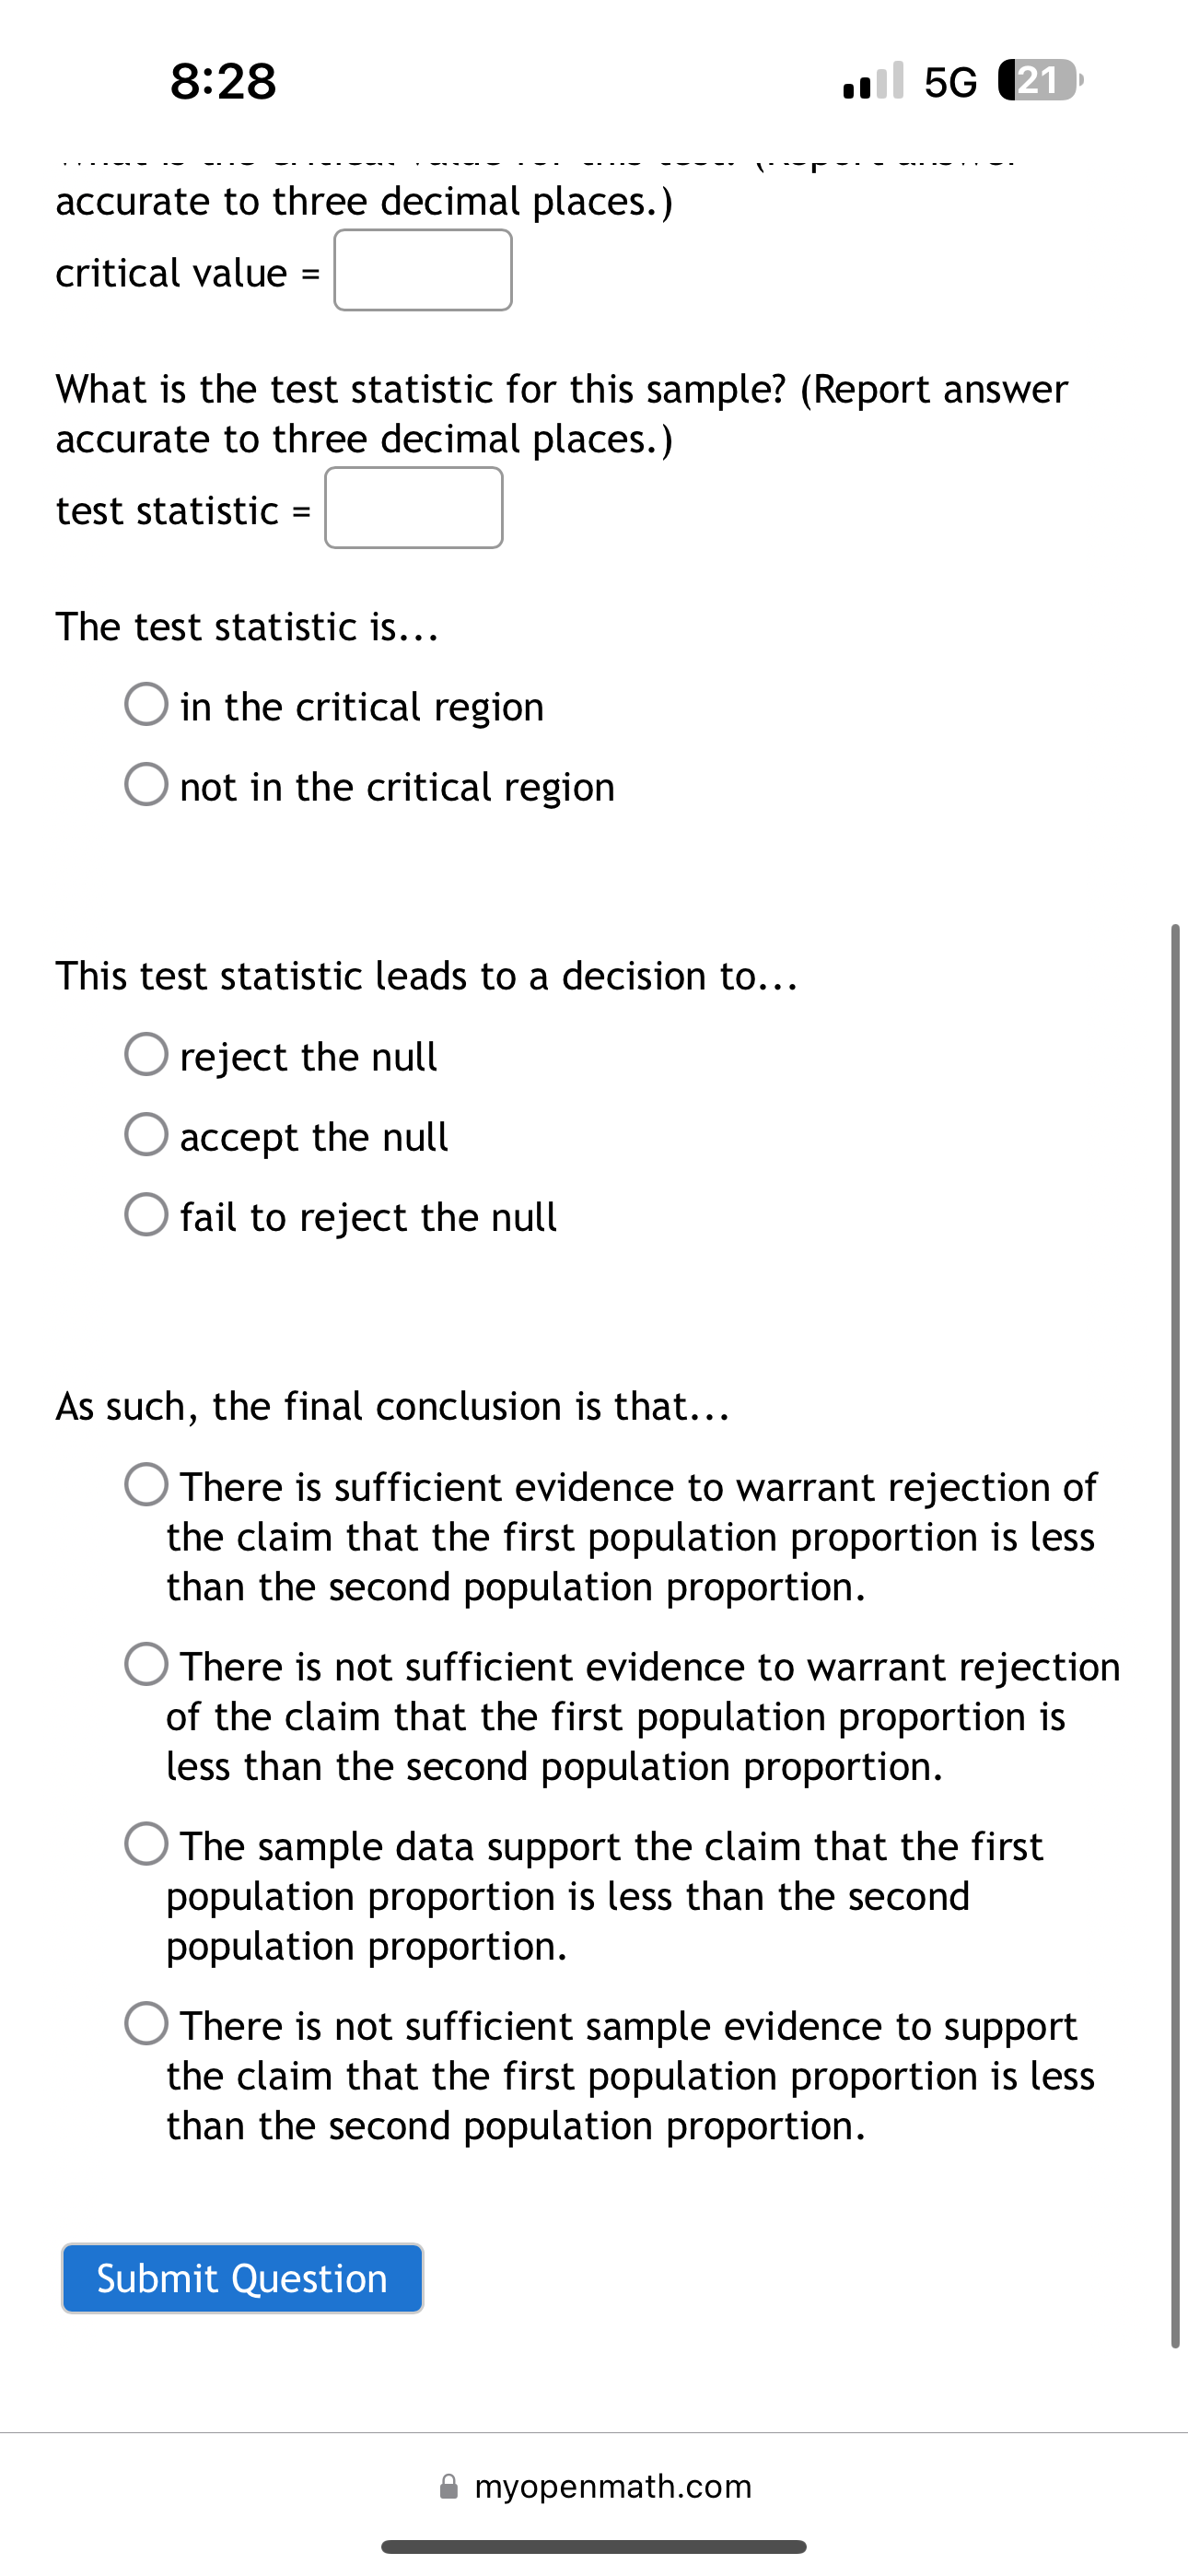
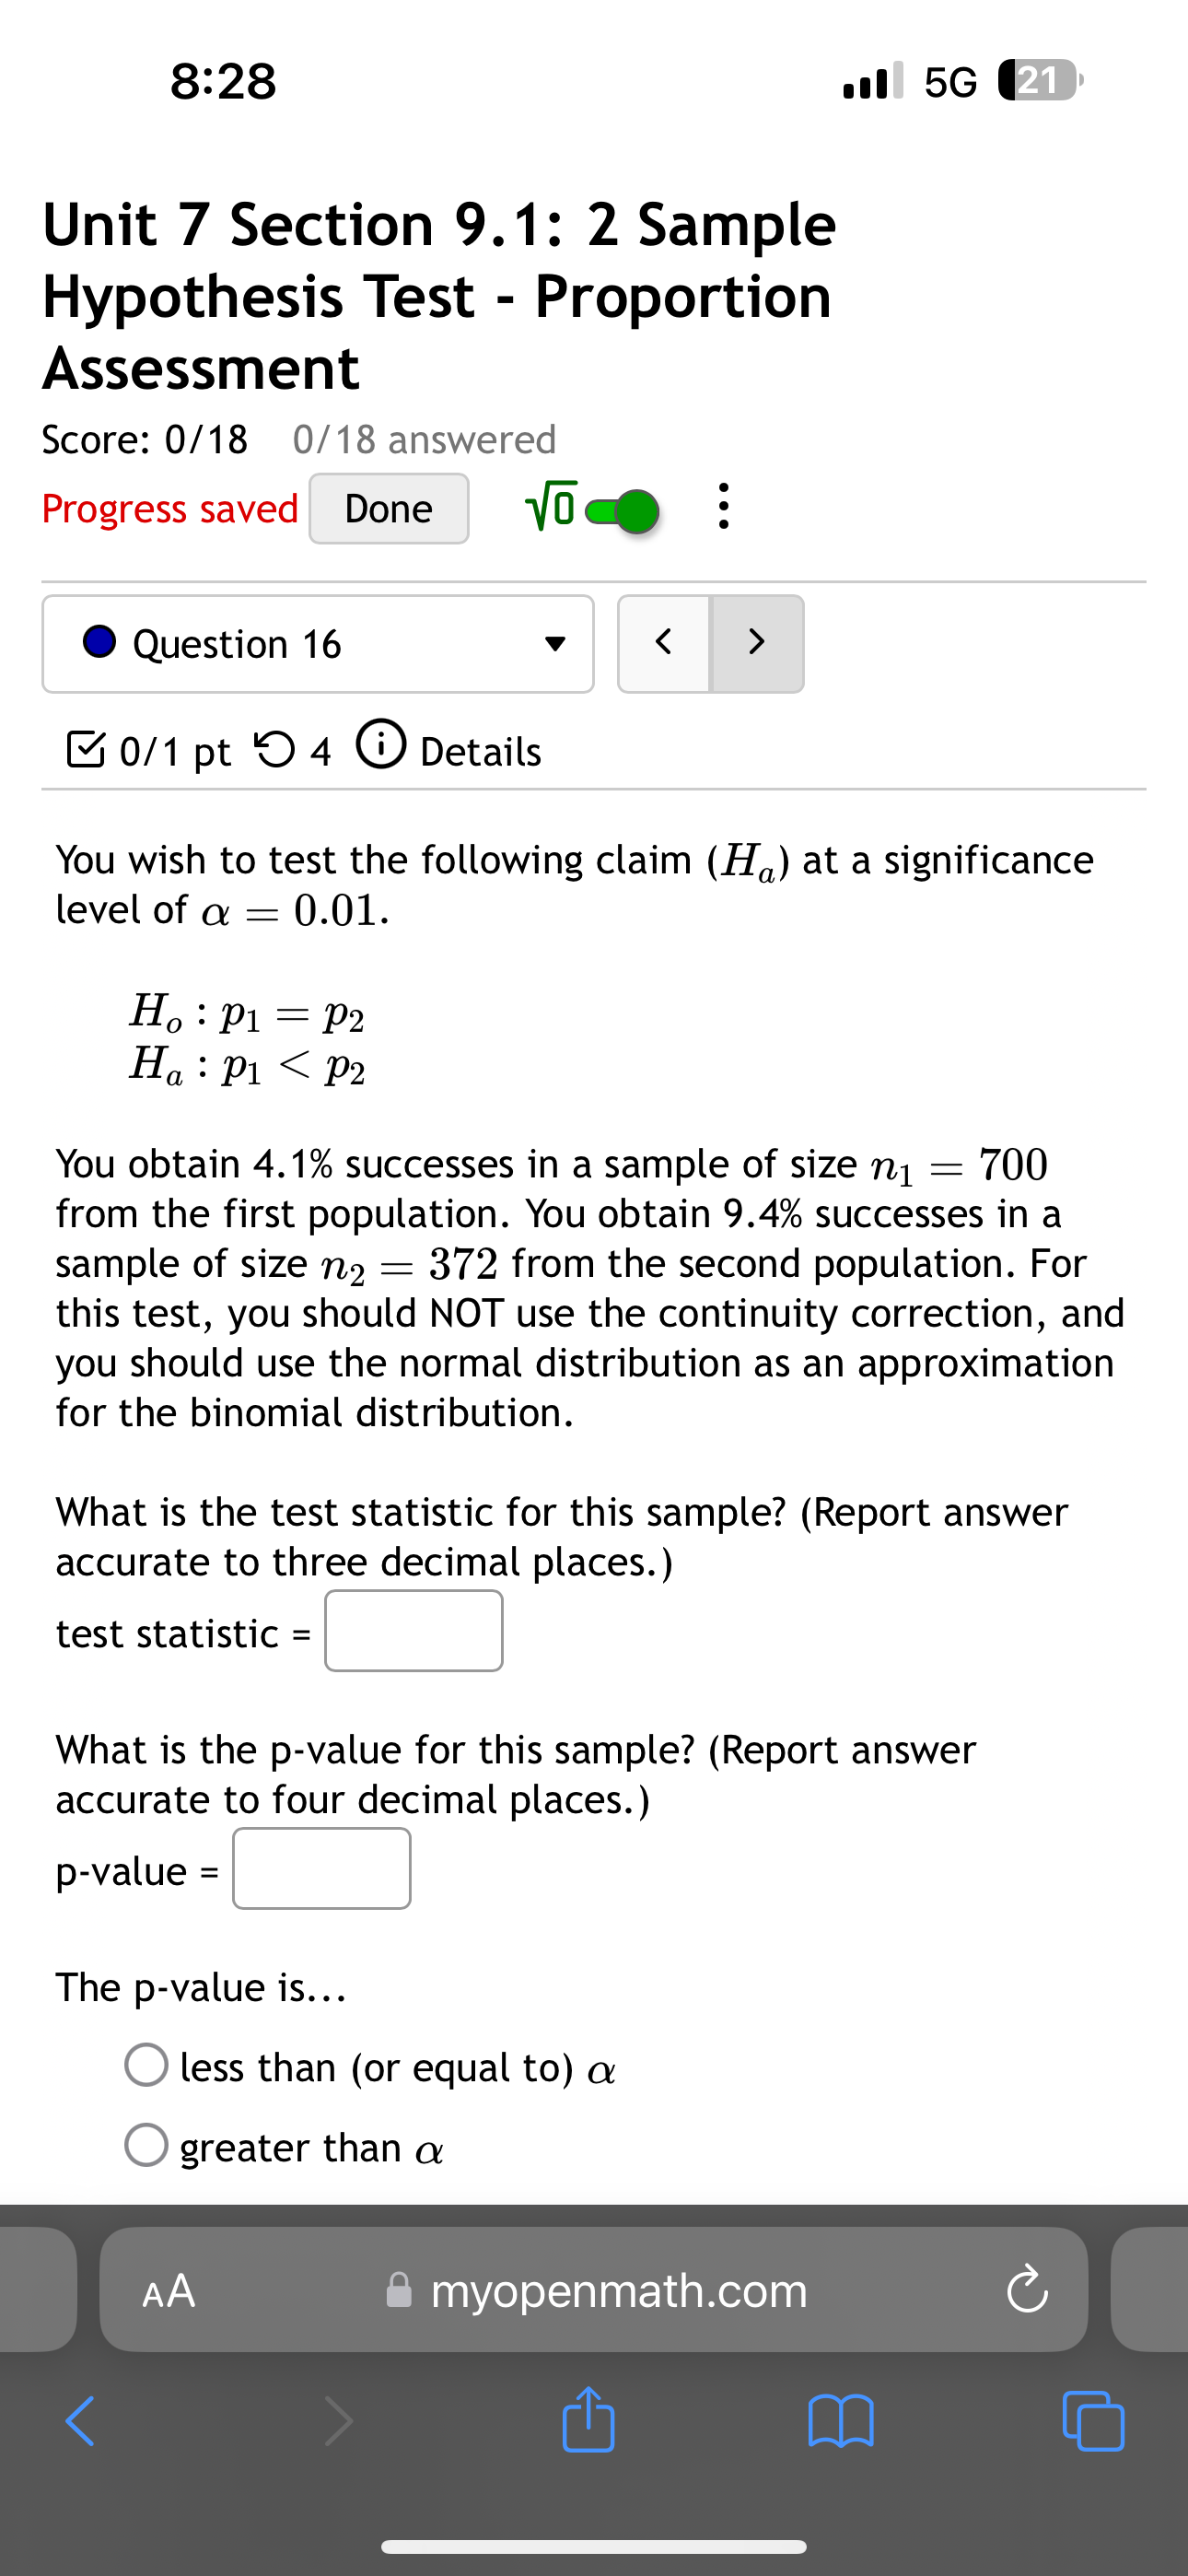
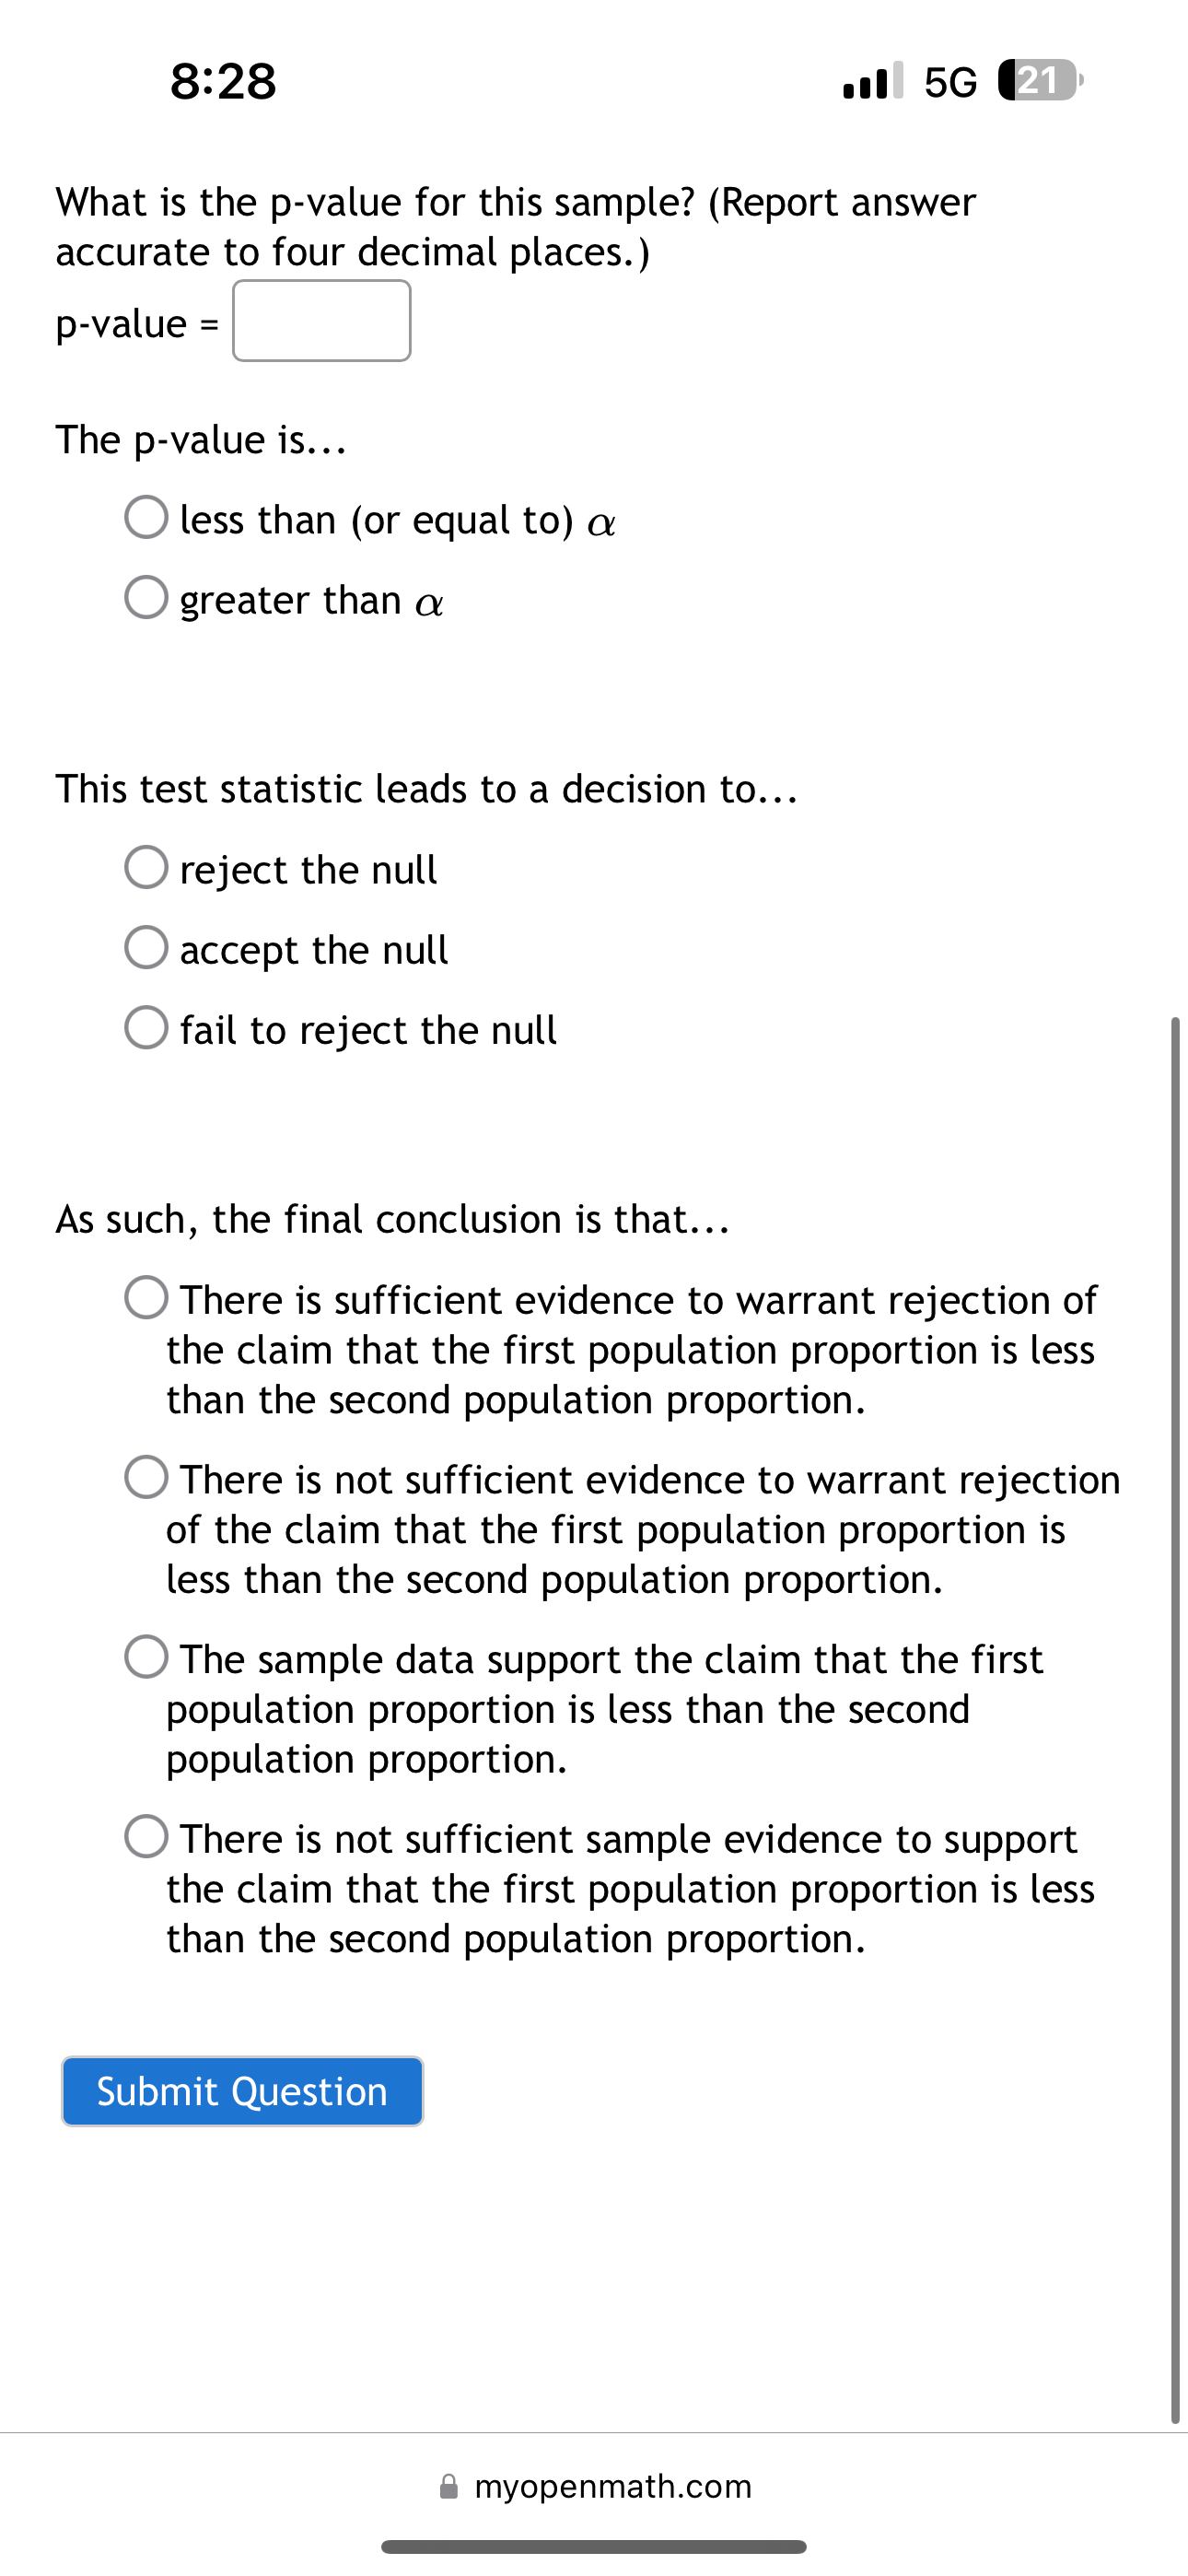
8:27 w56 ( Unit 7 Section 9.1: 2 Sample Hypothesis Test - Proportion Assessment Score: 0/18 0/18 answered Progress saved Done Vle@ : @ Question 1 v & 0/1 pt O 4 O Details You wish to test the following claim (H,) at a significance level of a = 0.05. H,:p1=p H,:p1>po You obtain 71.7% successes in a sample of size n; = 791 from the first population. You obtain 62.5% successes in a sample of size ny = 546 from the second population. For this test, you should NOT use the continuity correction, and you should use the normal distribution as an approximation for the binomial distribution. What is the test statistic for this sample? (Report answer accurate to three decimal places.) test statistic = What is the p-value for this sample? (Report answer accurate to four decimal places.) p-value = The p-value is... O less than (or equal to) o () greater than & myopenmath.com 8:27 all 56 ( test statistic = What is the p-value for this sample? (Report answer accurate to four decimal places.) p-value = The p-value is... (O less than (or equal to) (O greater than This test statistic leads to a decision to... O reject the null hypothesis (O accept the null hypothesis (O fail to reject the null hypothesis As such, the final conclusion is that... (O There is sufficient evidence to warrant rejection of the claim that the first population proportion is greater than the second population proportion. O There is not sufficient evidence to warrant rejection of the claim that the first population proportion is greater than the second population proportion. (O The sample data support the claim that the first population proportion is greater than the second population proportion. (O There is not sufficient sample evidence to support the claim that the first population proportion is greater than the second population proportion. Submit Question & myopenmath.com 8:27 .1 5G 21 Score: 0/18 0/18 answered Progress saved Done VO CO Question 2 PF H1 : MM > UF O Ho : PM = PF Ho : UM = UF Ho : PM = PF H1 : PM & 0/1 pt D 4 O Details You wish to test the following claim (H,) at a significance level of a = 0.005. H,:p1=p H,:p1 > po You obtain 88.9% successes in a sample of size n; = 432 from the first population. You obtain 81.4% successes in a sample of size ny, = 574 from the second population. For this test, you should NOT use the continuity correction, and you should use the normal distribution as an approximation for the binomial distribution. What is the test statistic for this sample? (Report answer accurate to three decimal places.) test statistic = What is the p-value for this sample? (Report answer accurate to four decimal places.) p-value = The p-value is... O less than (or equal to) () greater than This test statistic leads to a decision to... (O reject the null (O accept the null (O fail to reject the null & myopenmath.com 8:27 w56 ( What is the p-value for this sample? (Report answer accurate to four decimal places.) p-value = The p-value is... () less than (or equal to) O greater than o This test statistic leads to a decision to... O reject the null (O accept the null (O fail to reject the null As such, the final conclusion is that... (O There is sufficient evidence to warrant rejection of the claim that the first population proportion is greater than the second population proportion. (O There is not sufficient evidence to warrant rejection of the claim that the first population proportion is greater than the second population proportion. (O The sample data support the claim that the first population proportion is greater than the second population proportion. (O There is not sufficient sample evidence to support the claim that the first population proportion is greater than the second population proportion. Submit Question & myopenmath.com 8:27 sl 5G ' ' Unit 7 Section 9.1: 2 Sample Hypothesis Test - Proportion Assessment Score: 0/18 0/18 answered Progress saved Done Vle@ : @ Question 4 v & 0/1 pt O 4 O Details You are testing the claim that the proportion of men who own cats is significantly different than the proportion of women who own cats. You sample 180 men, and 65% own cats. You sample 80 women, and 40% own cats. Find the test statistic, rounded to two decimal places. @& myopenmath.com 8:27 w56 ( Unit 7 Section 9.1: 2 Sample Hypothesis Test - Proportion Assessment Score: 0/18 0/18 answered Progress saved Done Vle@ : @ Question 5 v & 0/1 pt O 4 O Details You wish to test the following claim (H,) at a significance level of a = 0.02. H,:p1=p H,:p1 # p2 You obtain 46.2% successes in a sample of size n; = 262 from the first population. You obtain 38.8% successes in a sample of size ny = 580 from the second population. For this test, you should NOT use the continuity correction, and you should use the normal distribution as an approximation for the binomial distribution. What is the test statistic for this sample? (Report answer accurate to three decimal places.) test statistic = What is the p-value for this sample? (Report answer accurate to four decimal places.) p-value = The p-value is... O less than (or equal to) o () greater than & myopenmath.com 8:27 w56 ( What is the p-value for this sample? (Report answer accurate to four decimal places.) p-value = The p-value is... () less than (or equal to) O greater than o This test statistic leads to a decision to... O reject the null hypothesis (O accept the null hypothesis (O fail to reject the null hypothesis As such, the final conclusion is that... (O There is sufficient evidence to warrant rejection of the claim that the first population proportion is not equal to the second population proprtion. (O There is not sufficient evidence to warrant rejection of the claim that the first population proportion is not equal to the second population proprtion. (O The sample data support the claim that the first population proportion is not equal to the second population proprtion. (O There is not sufficient sample evidence to support the claim that the first population proportion is not equal to the second population proprtion. Submit Question & myopenmath.com 8:27 w56 ( Unit 7 Section 9.1: 2 Sample Hypothesis Test - Proportion Assessment Score: 0/18 0/18 answered Progress saved Done V0 a@) @ Question 6 v & 0/1 pt 4 O Details You wish to test the following claim (H,) at a significance level of a = 0.05. H,:p1=po H,:p1
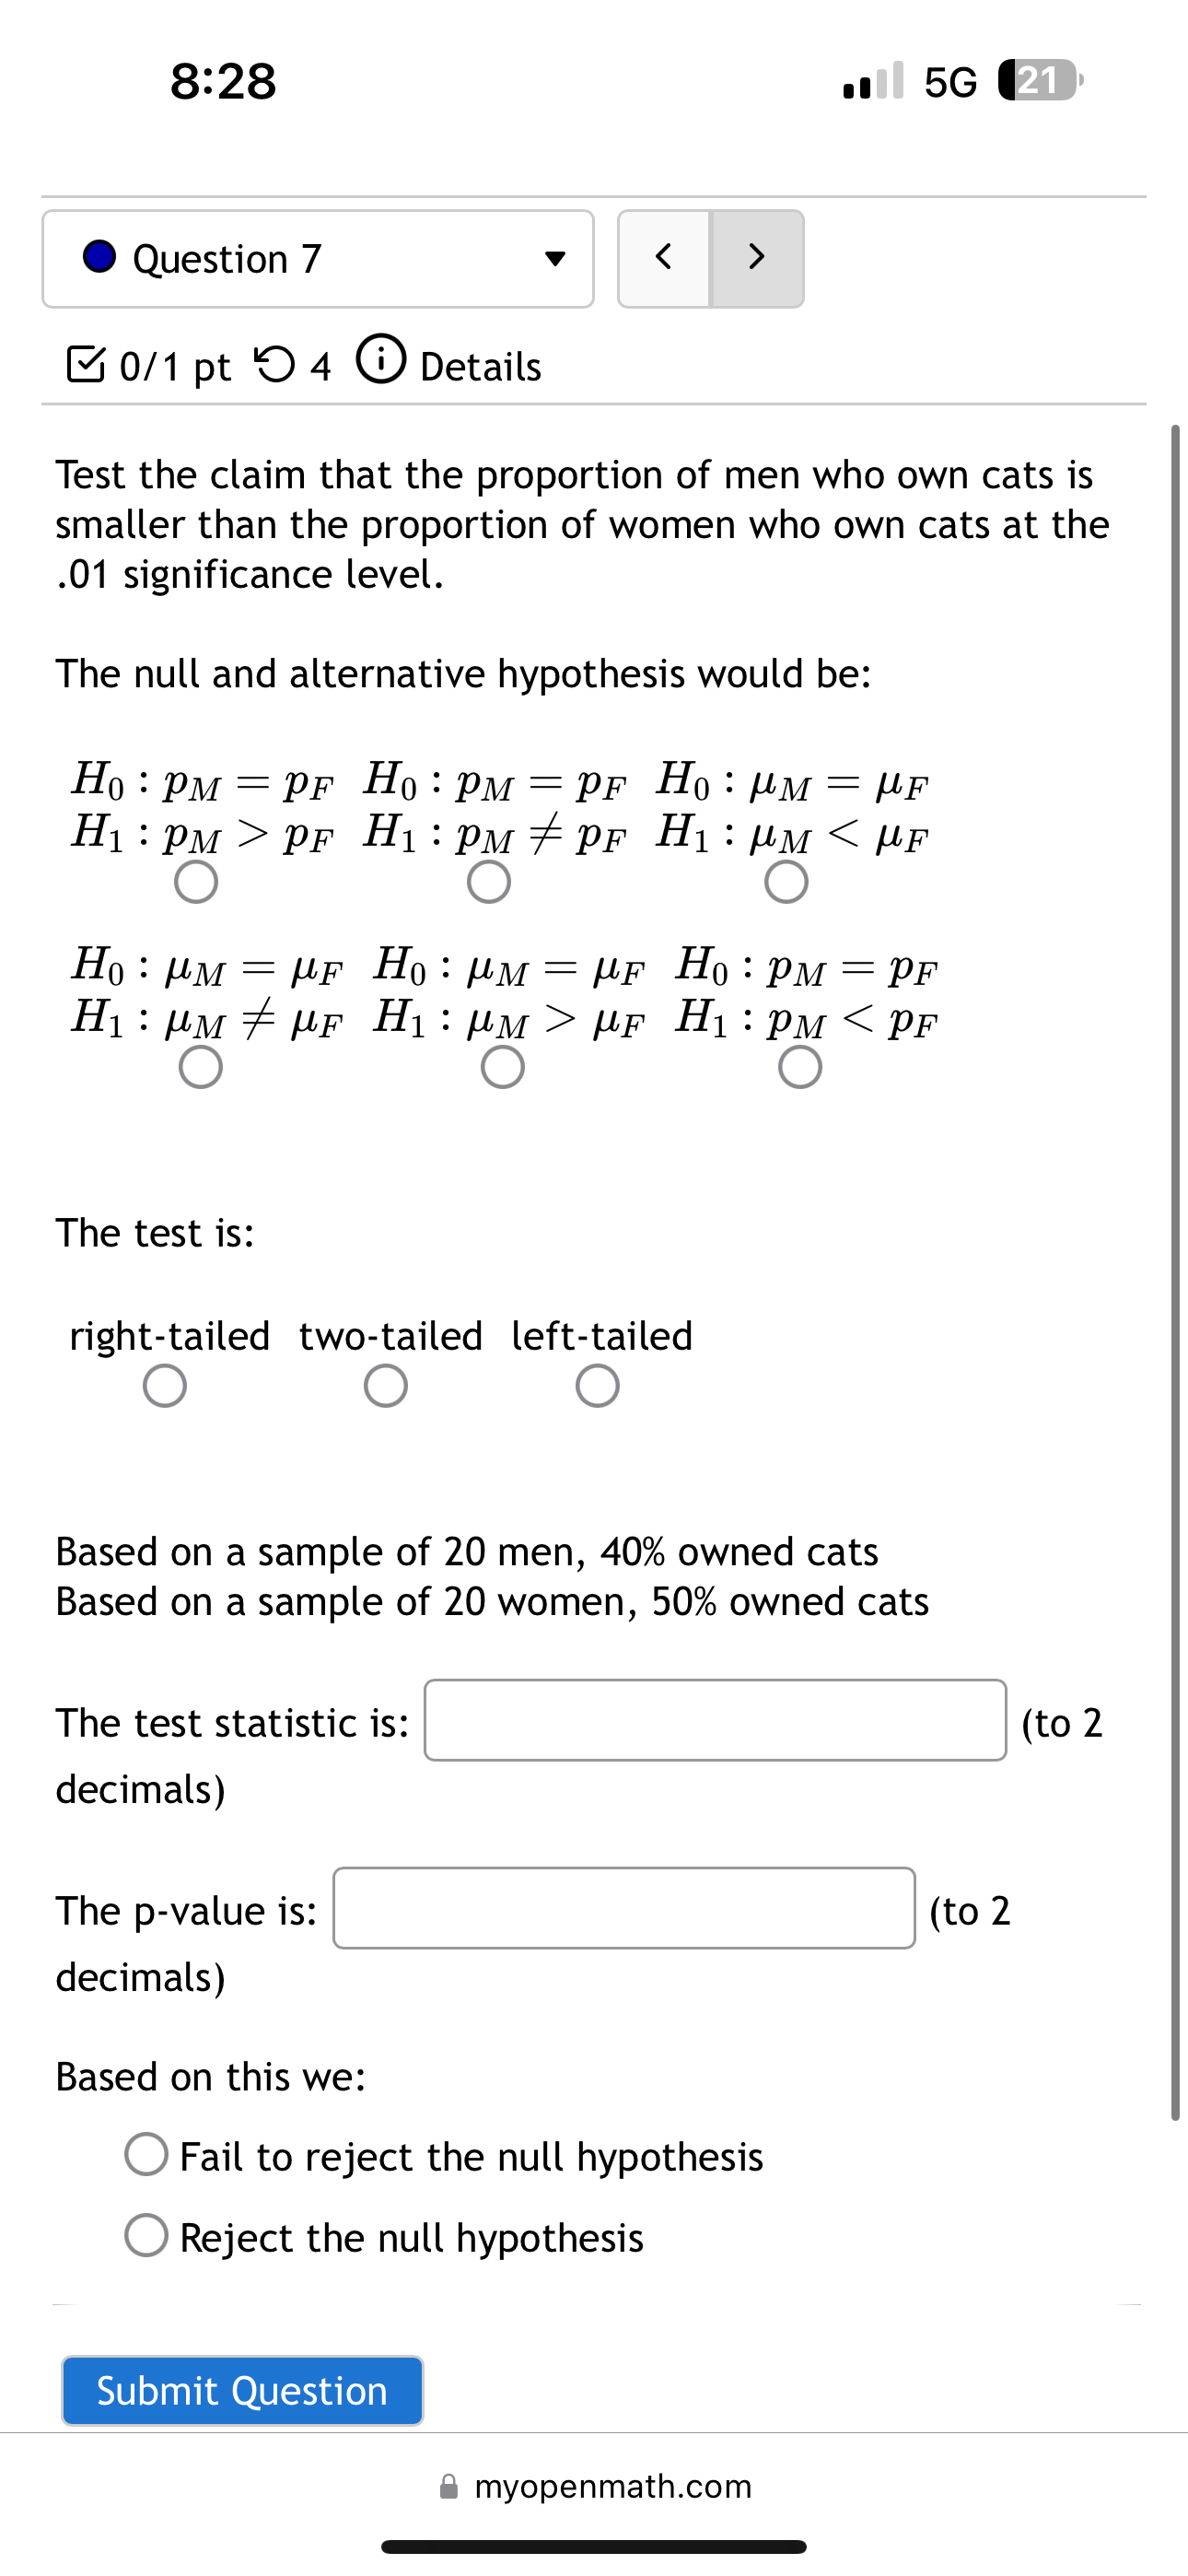
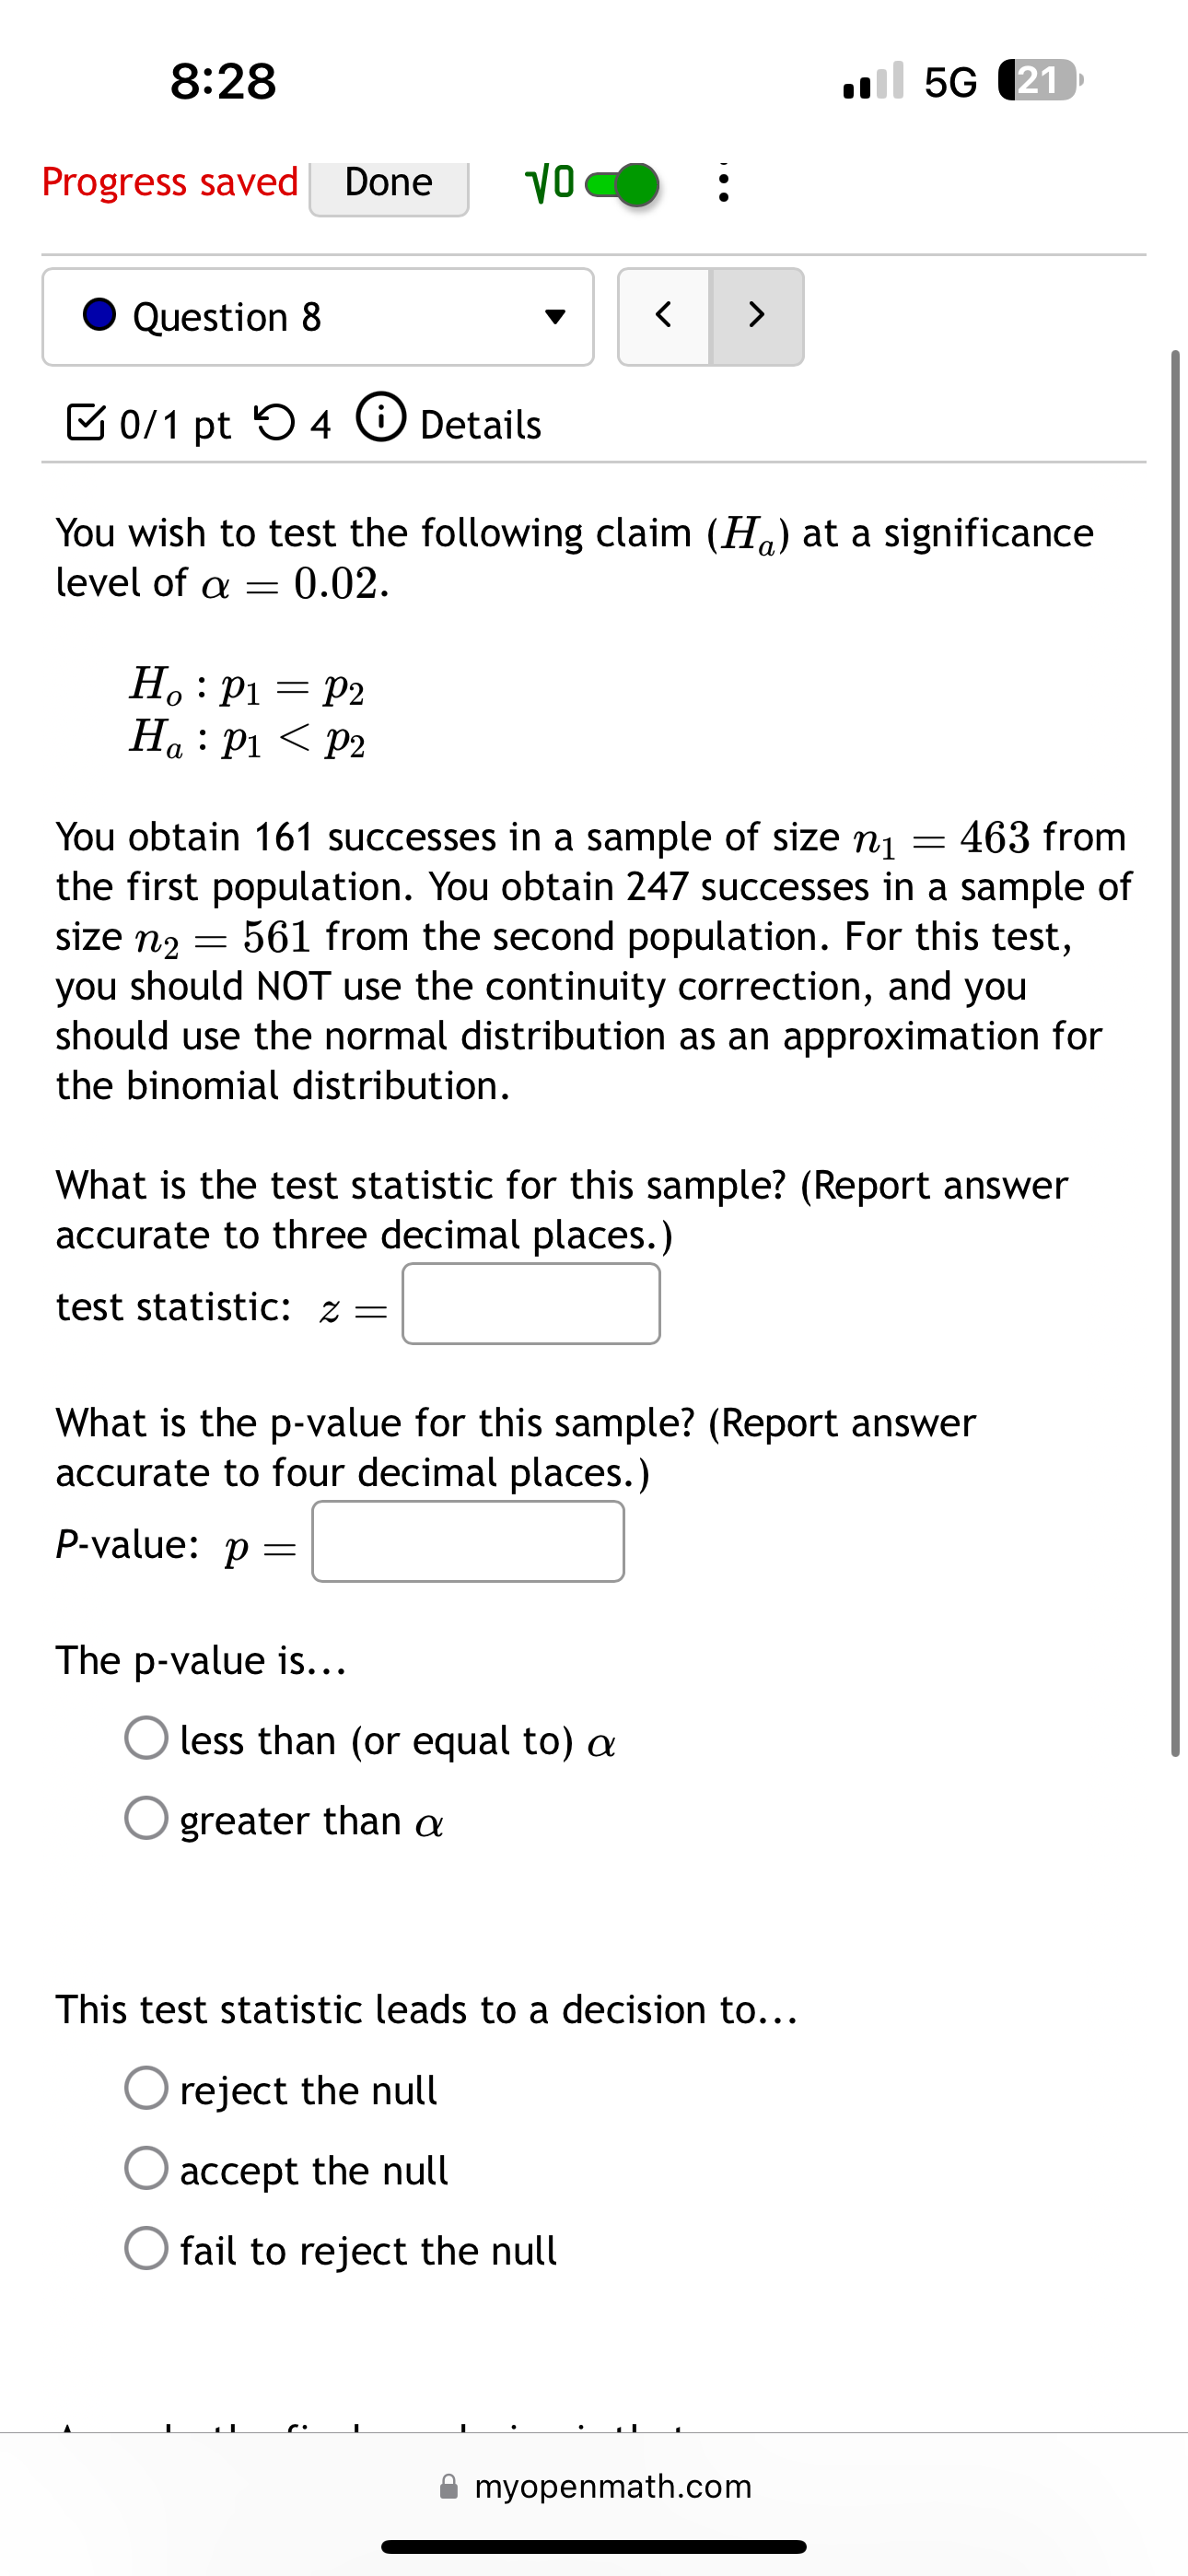
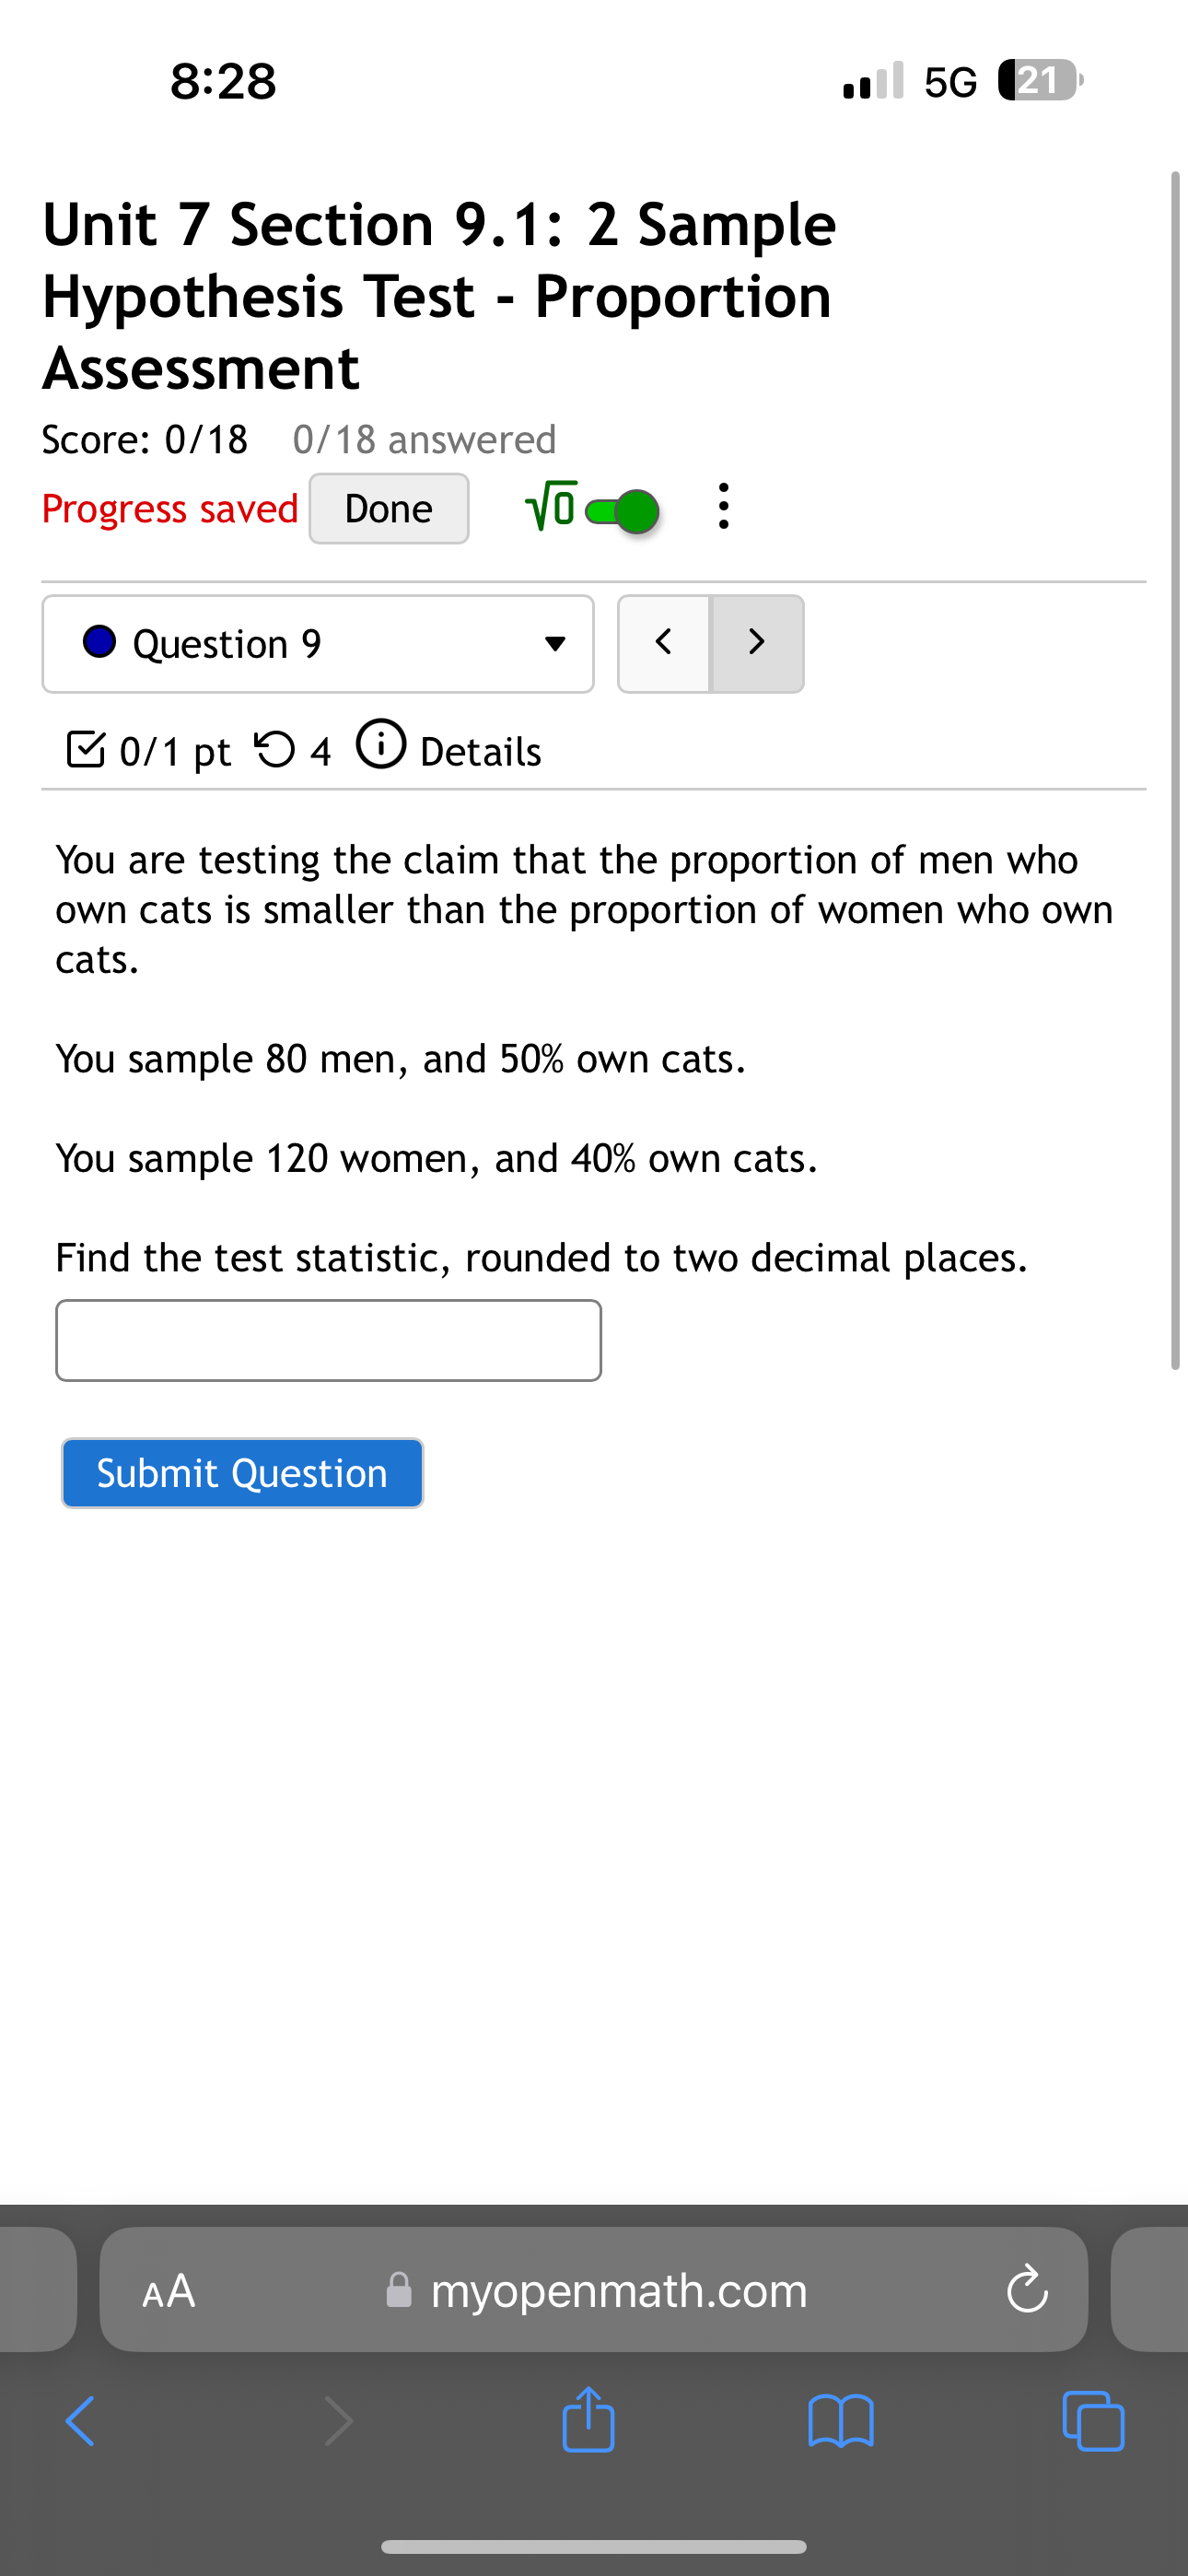
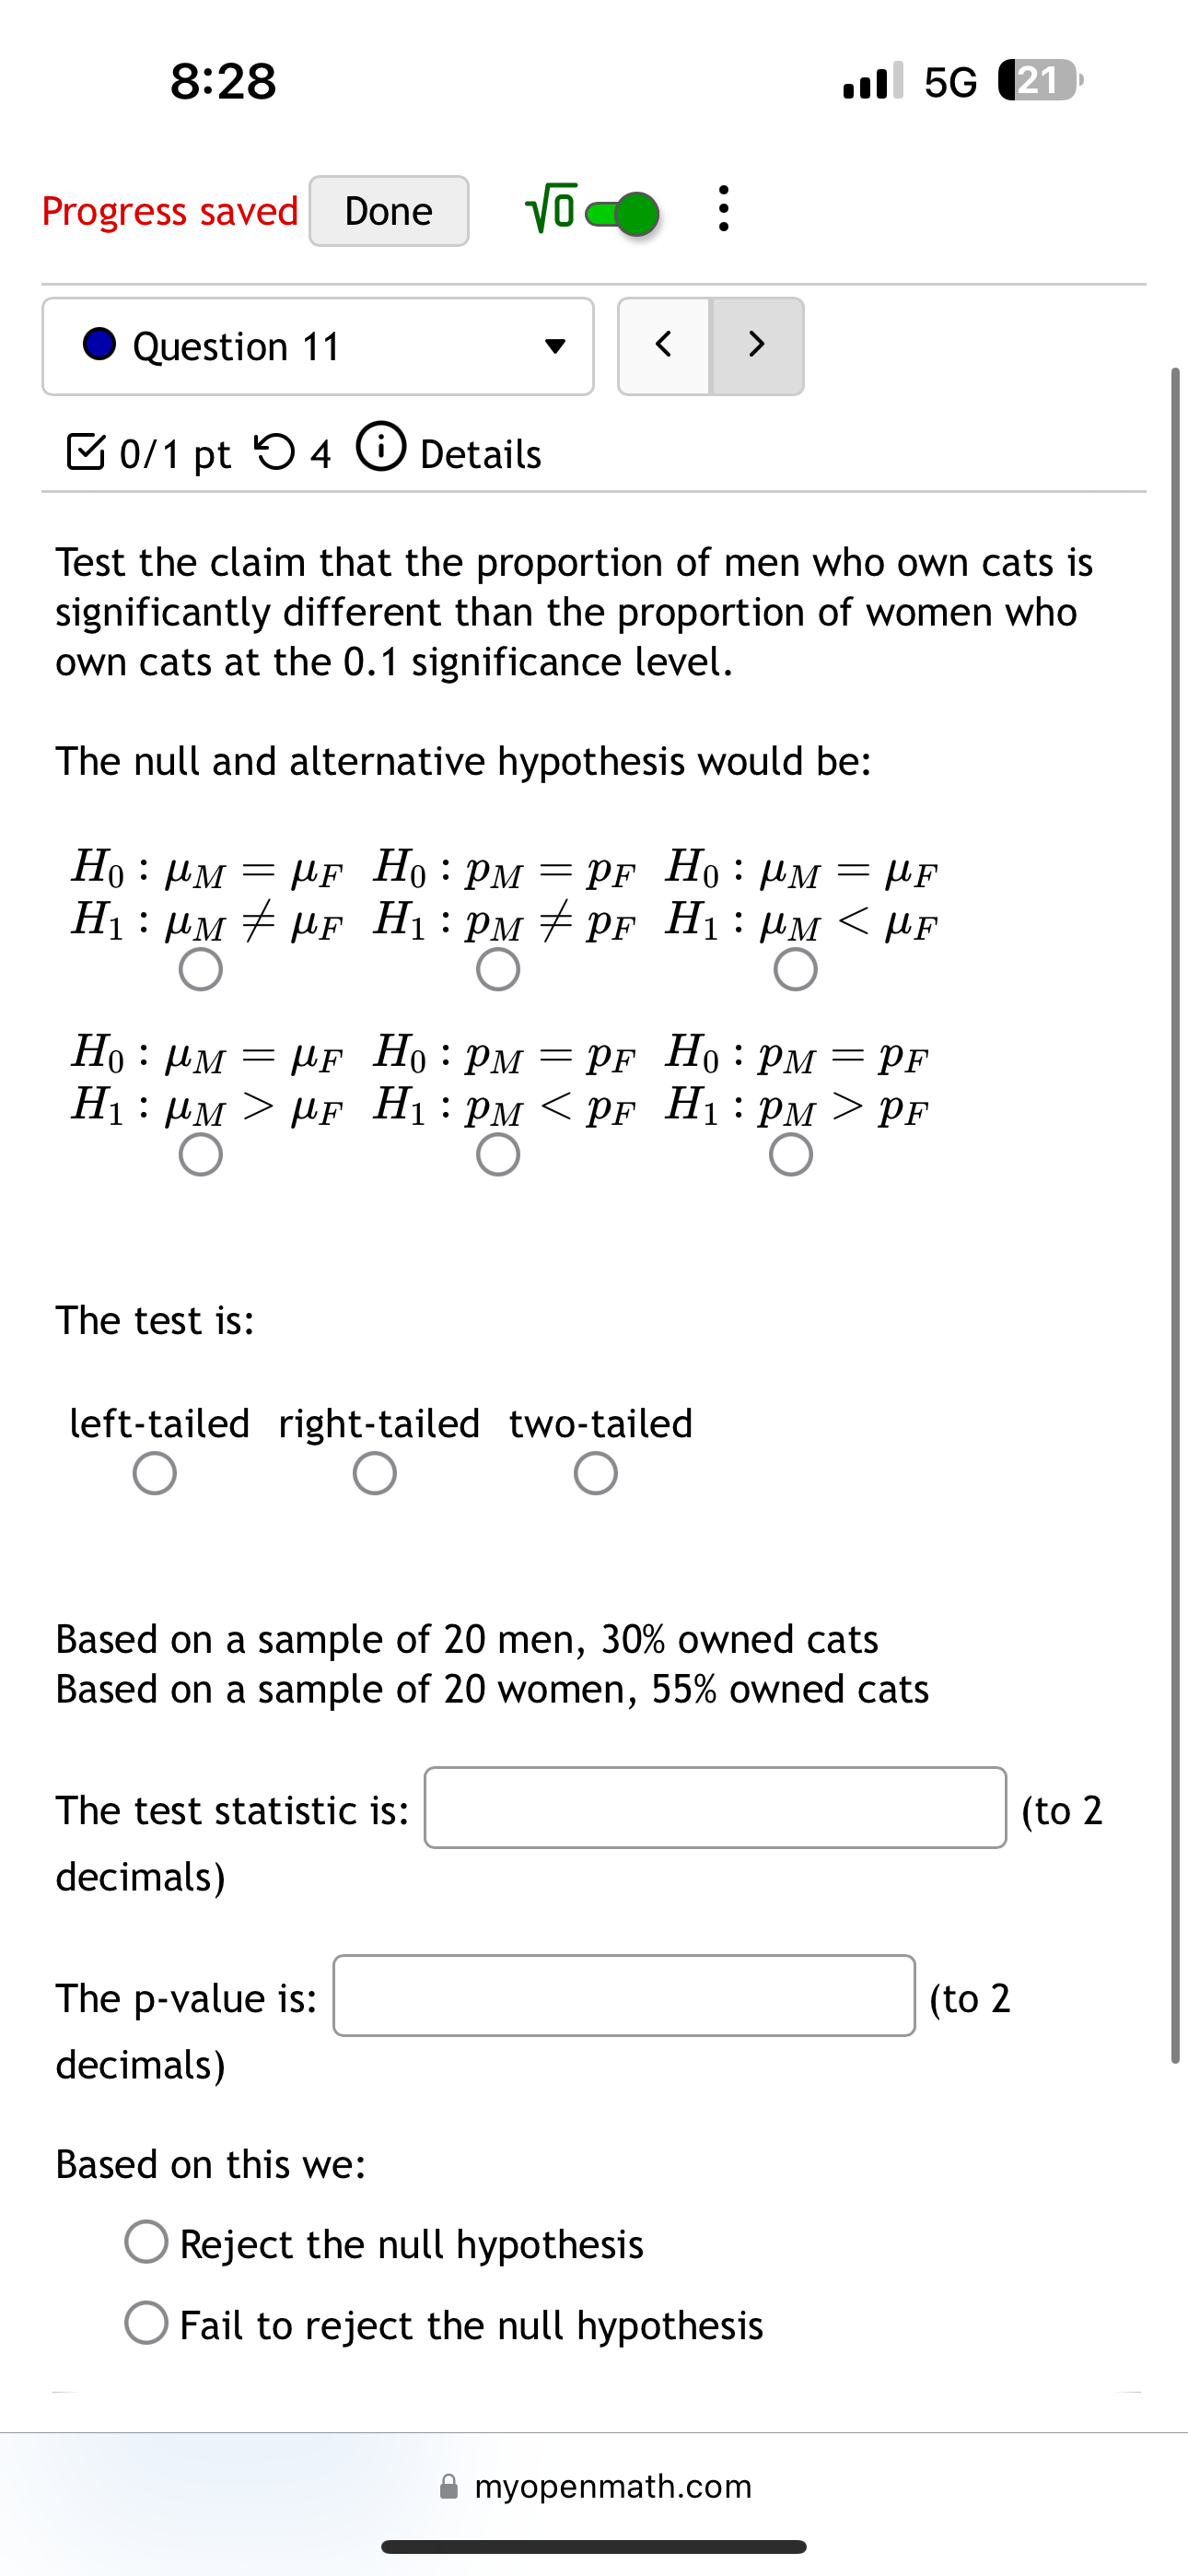
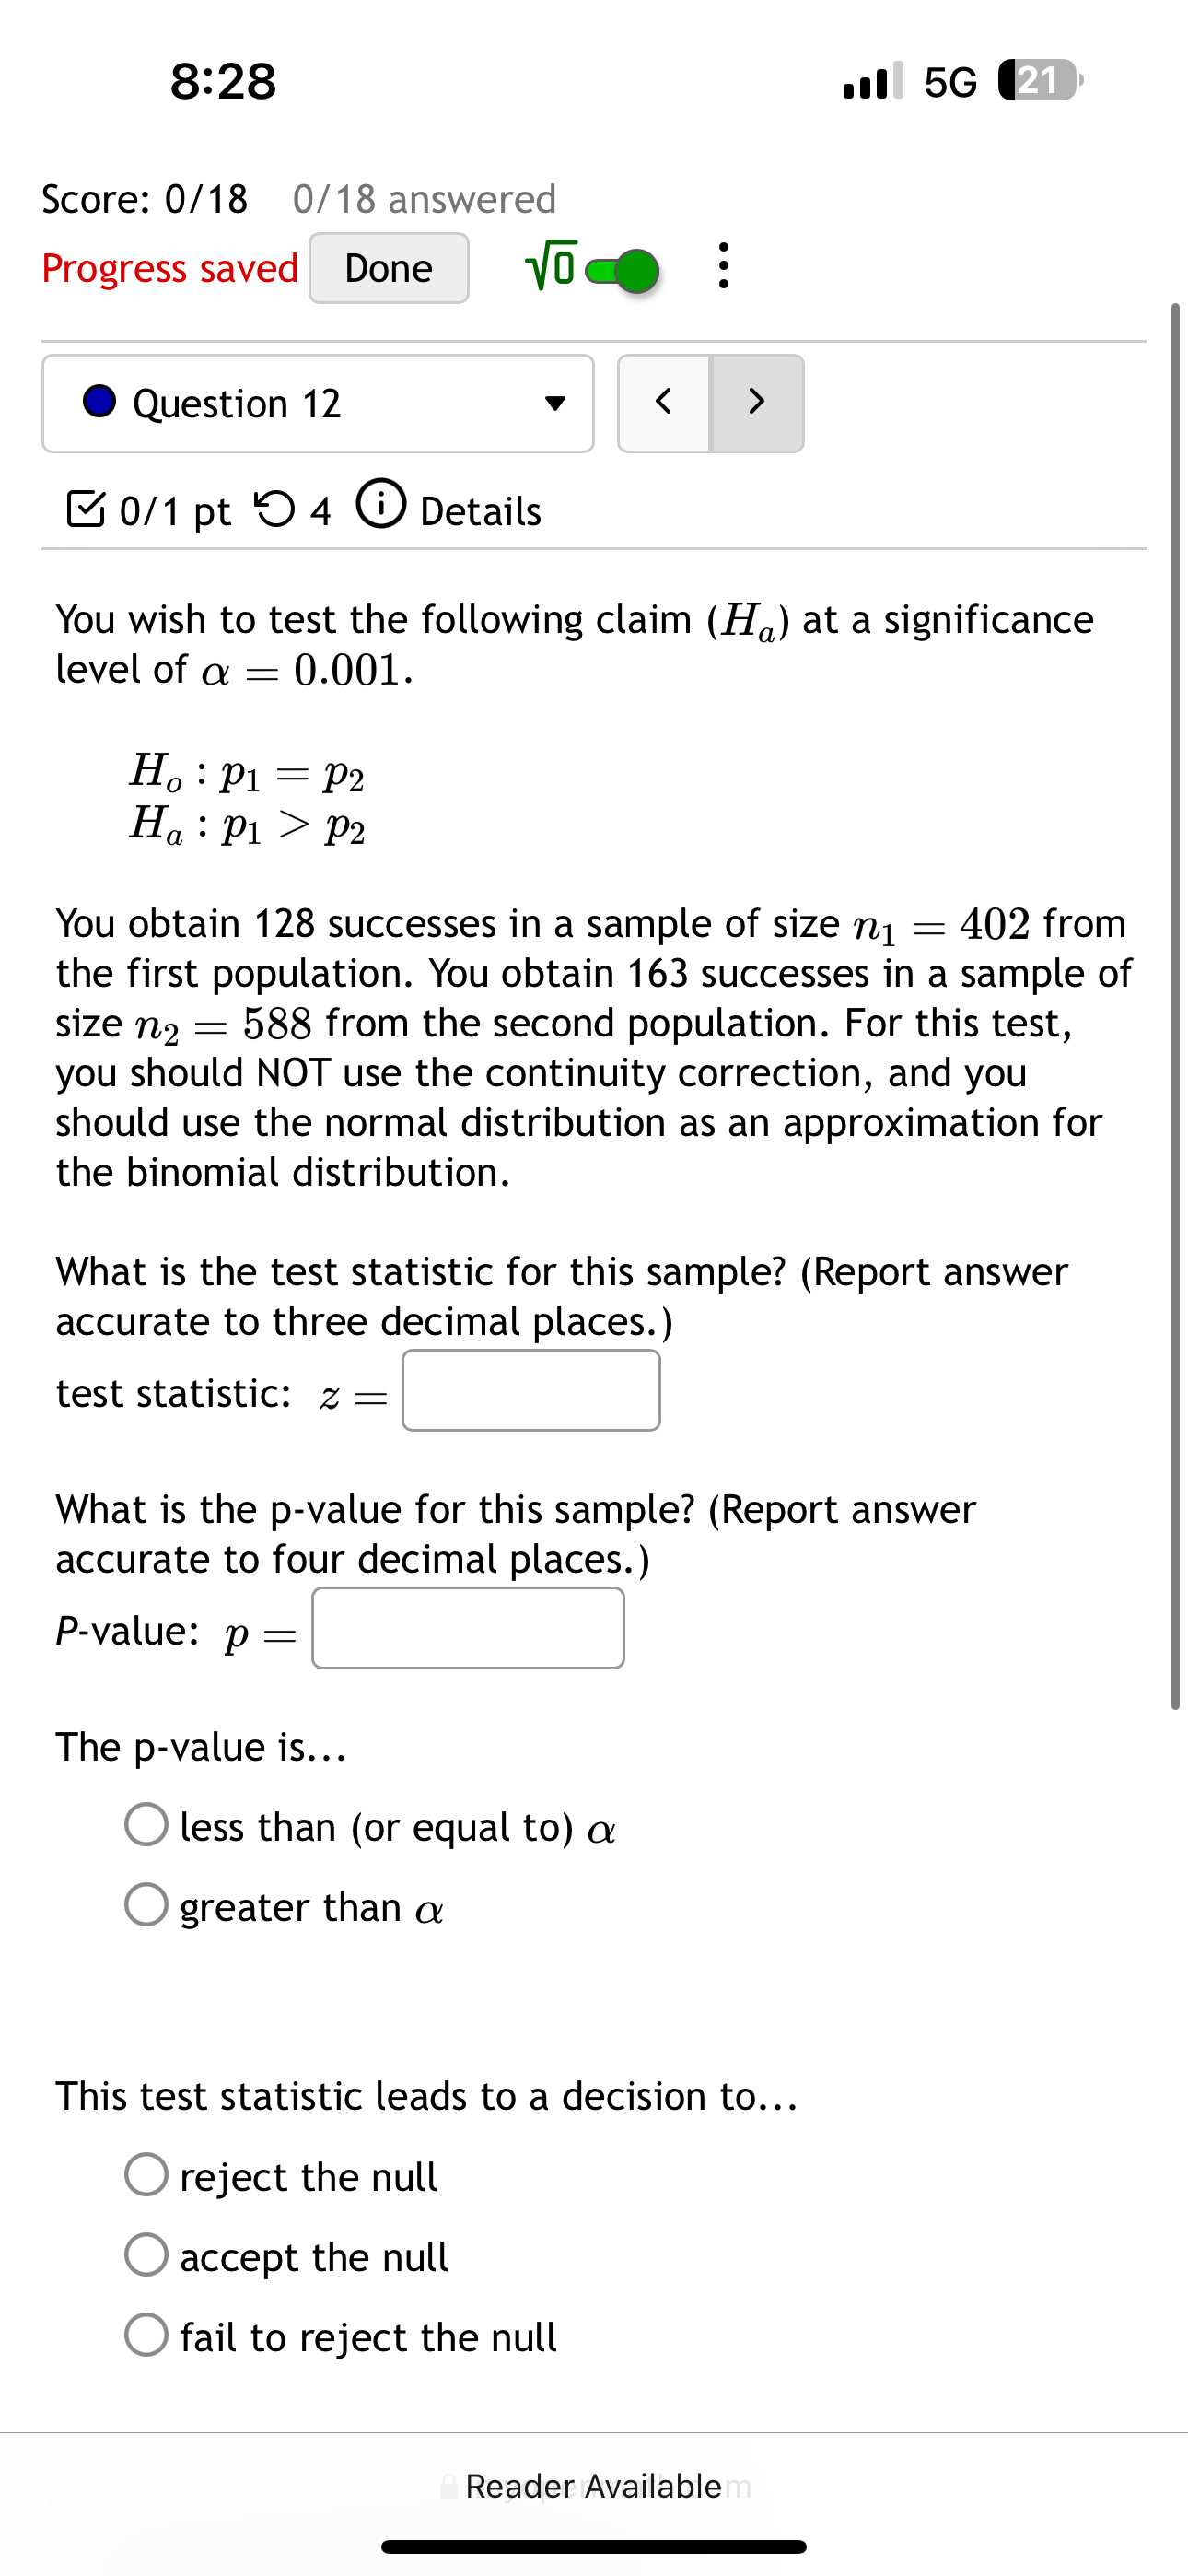
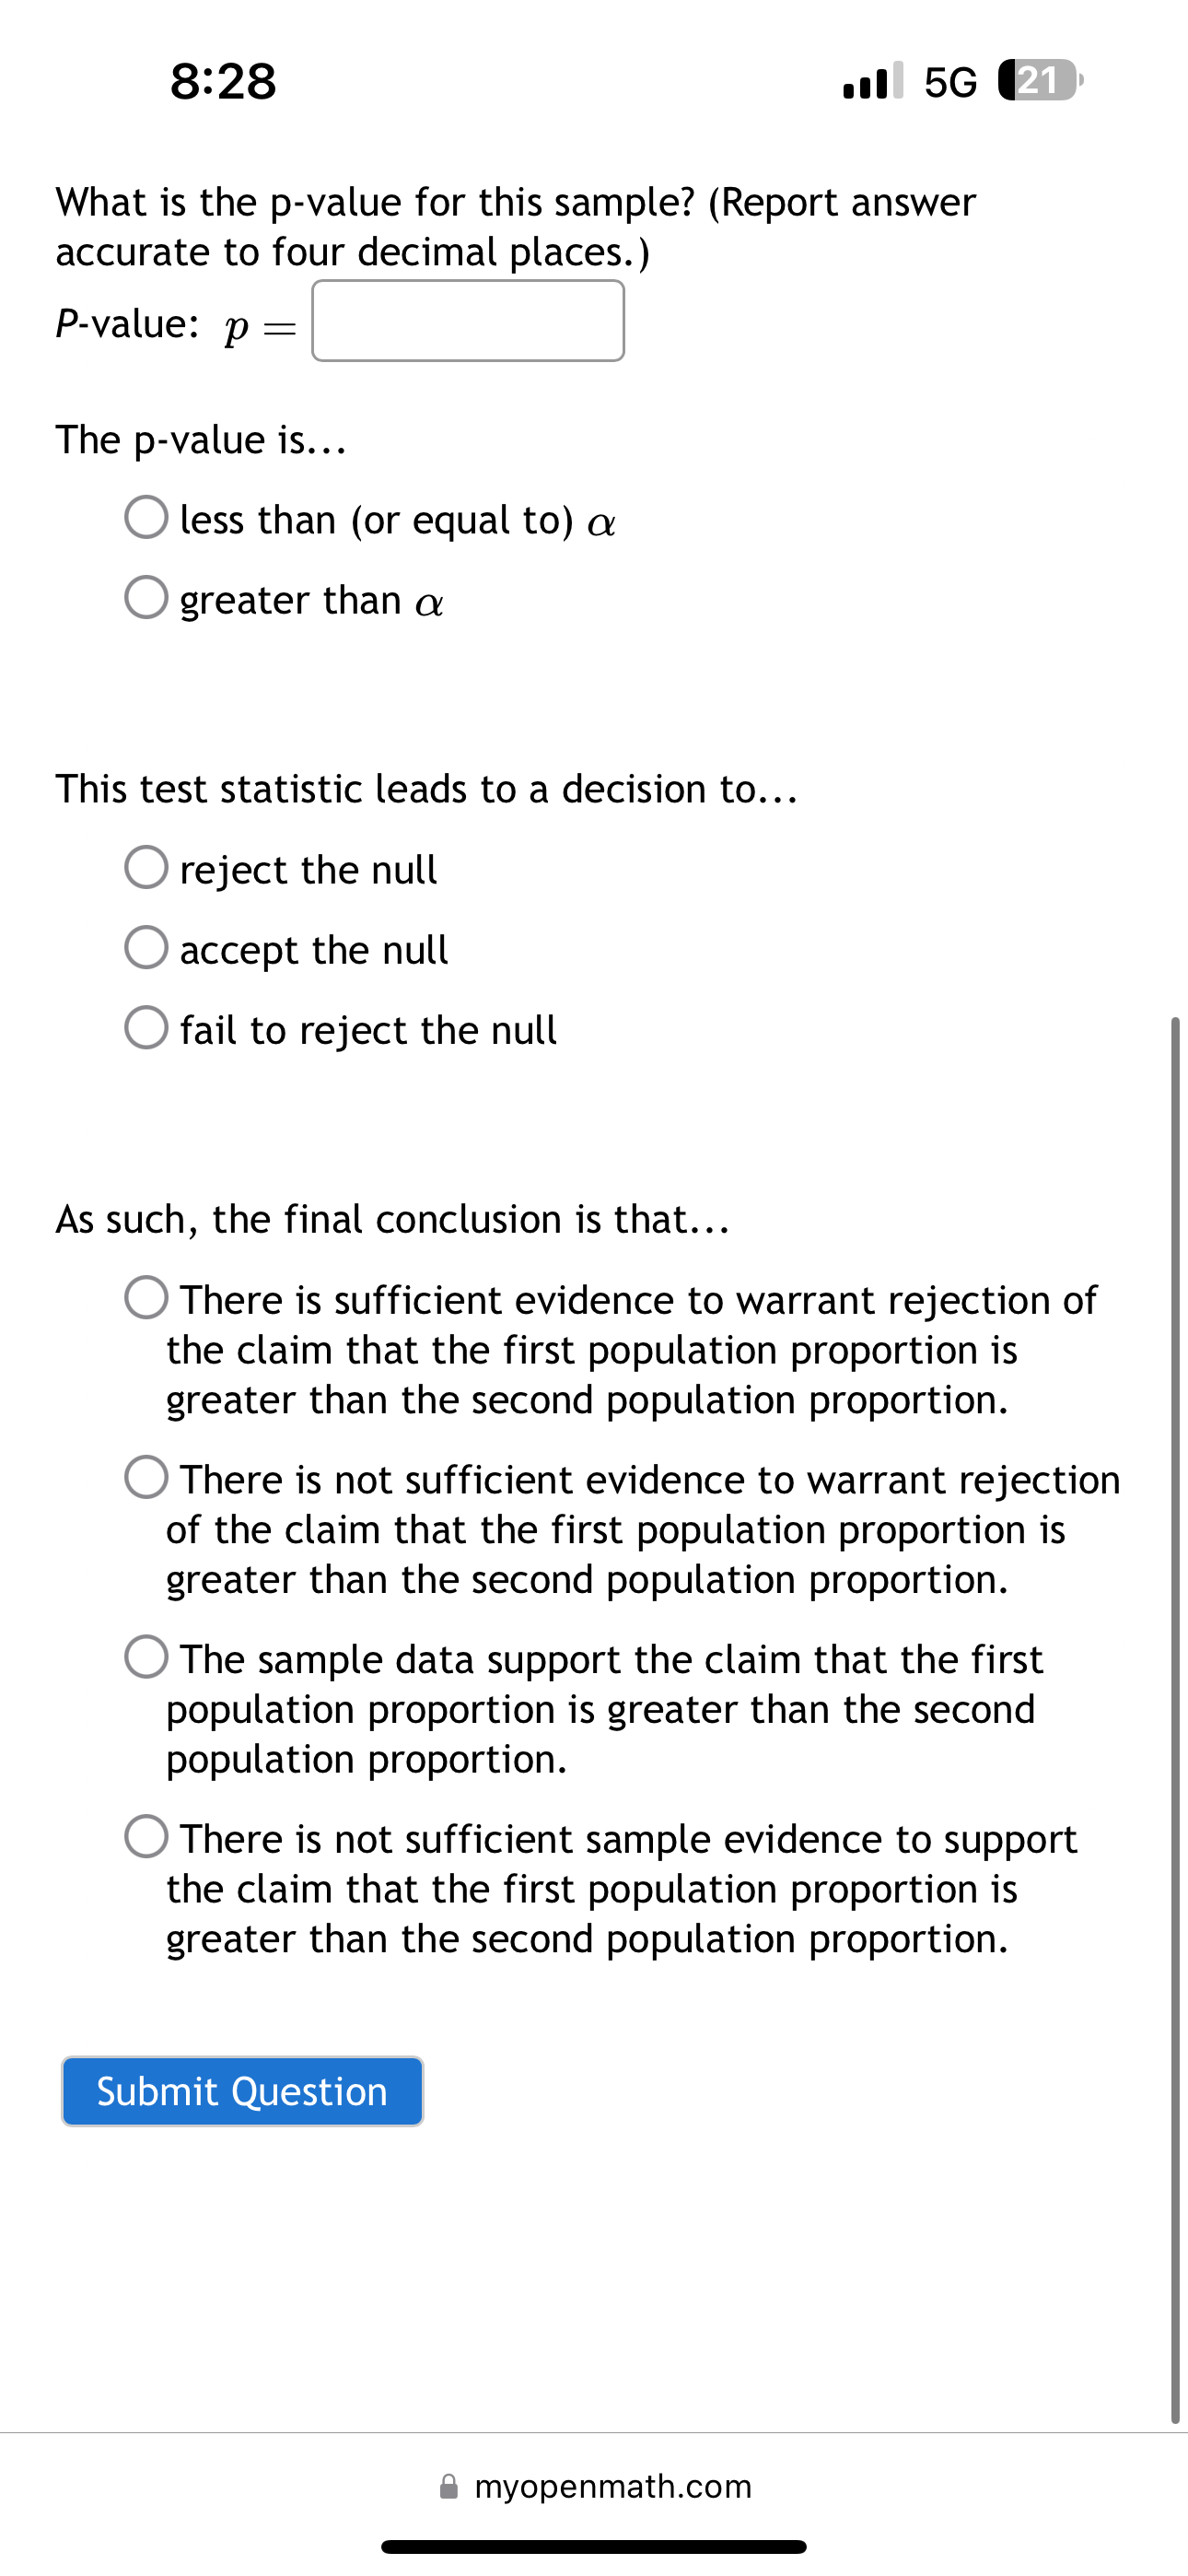
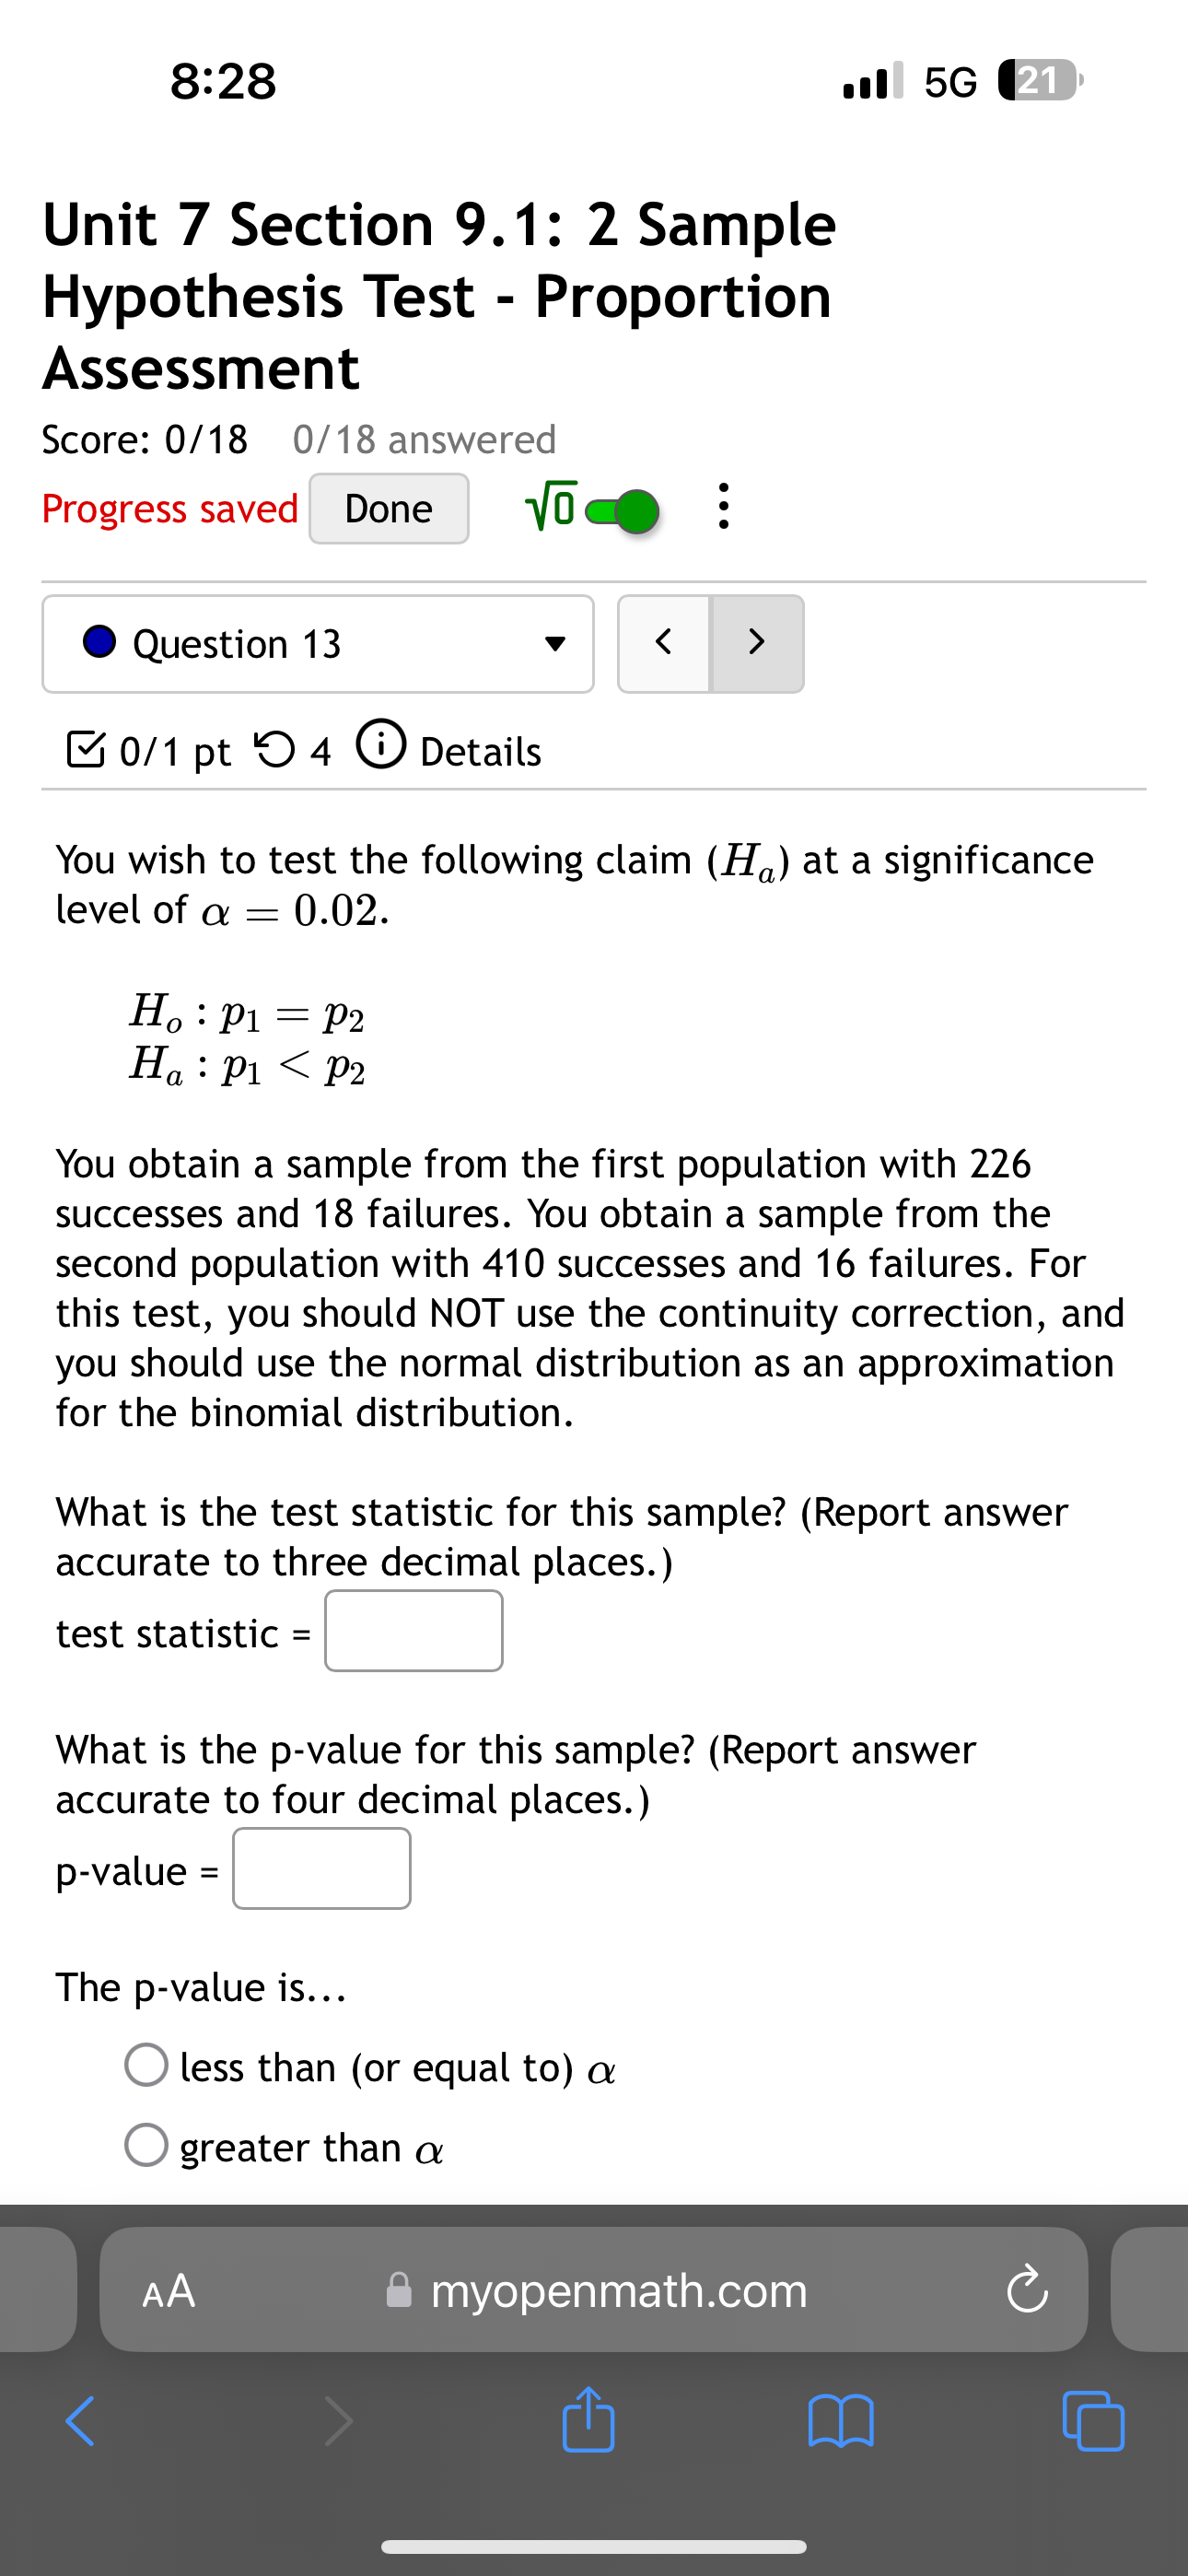
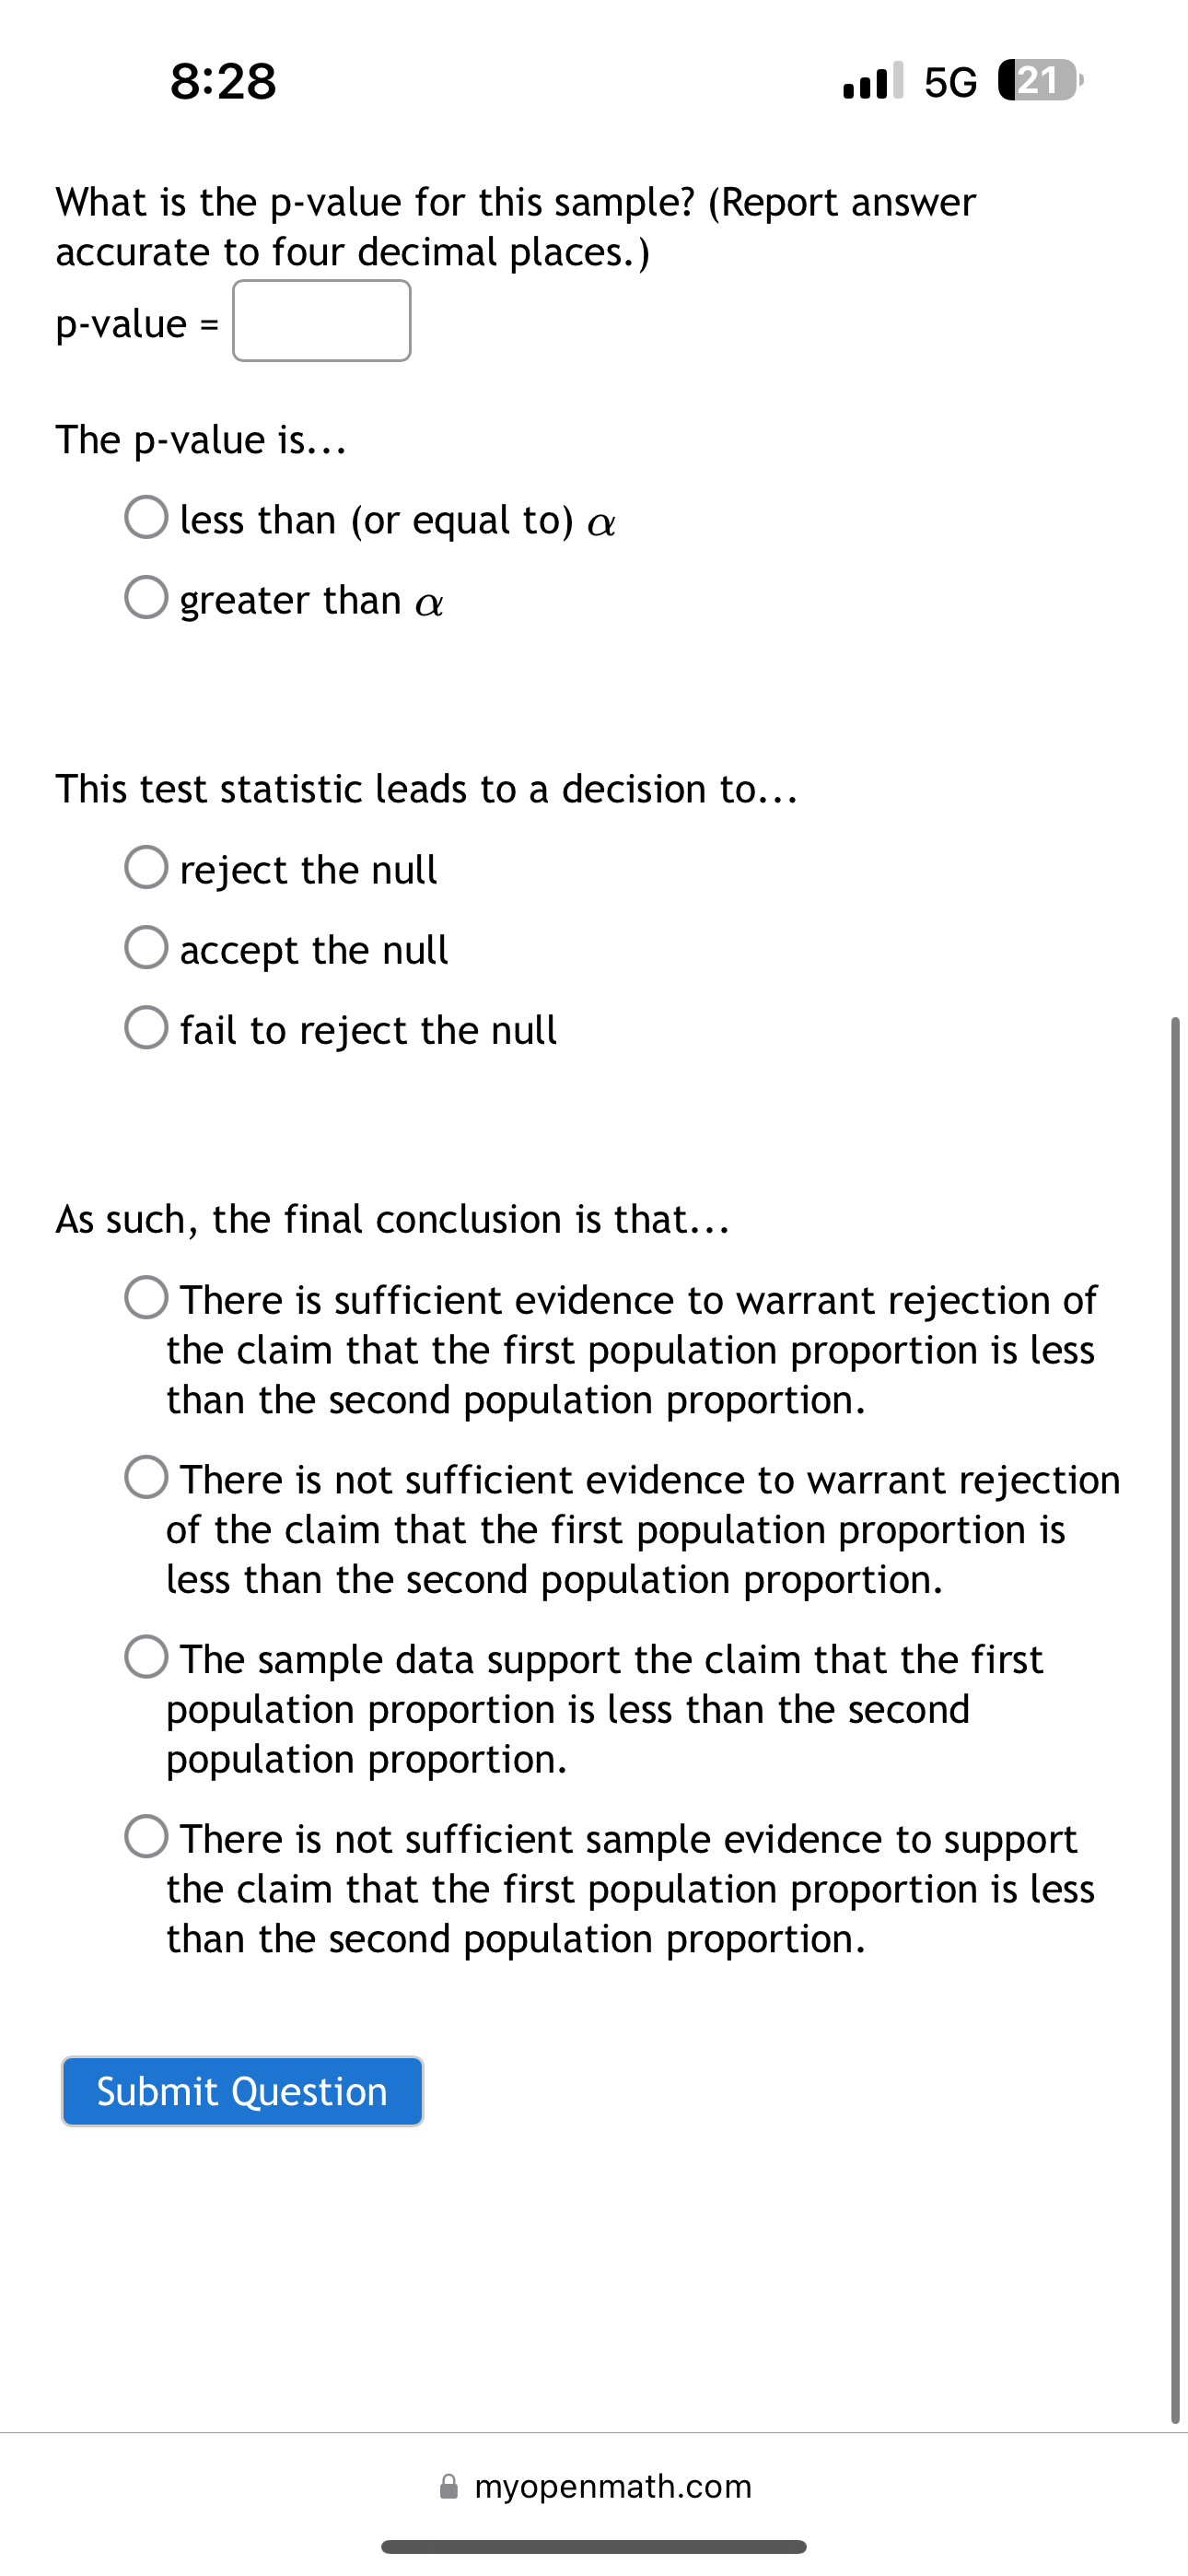
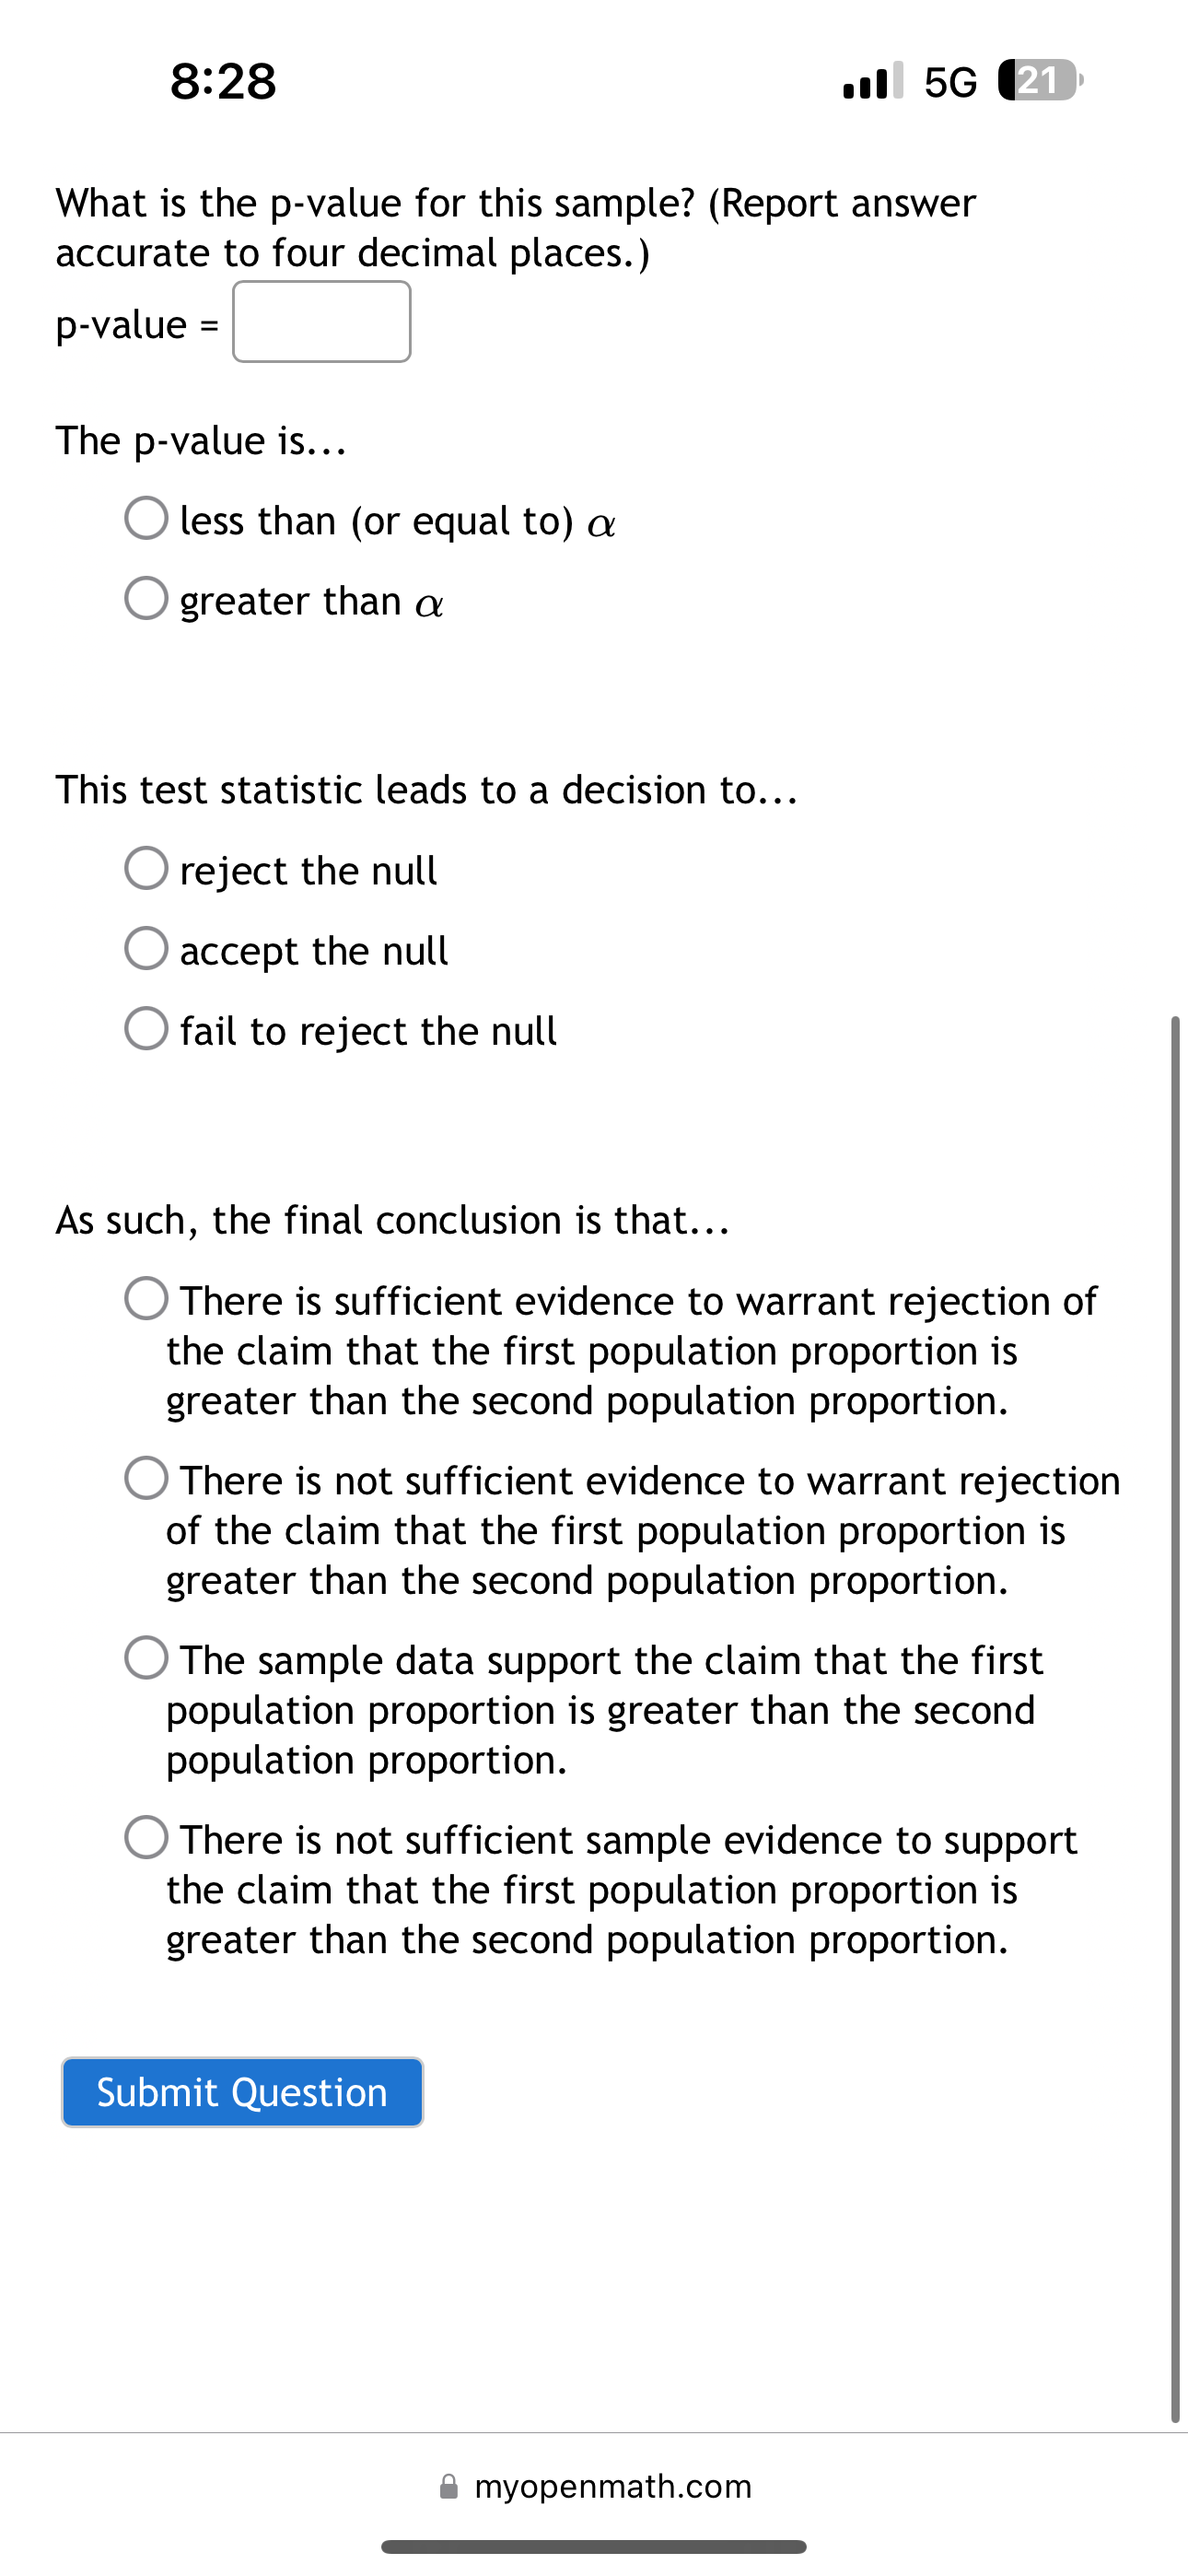
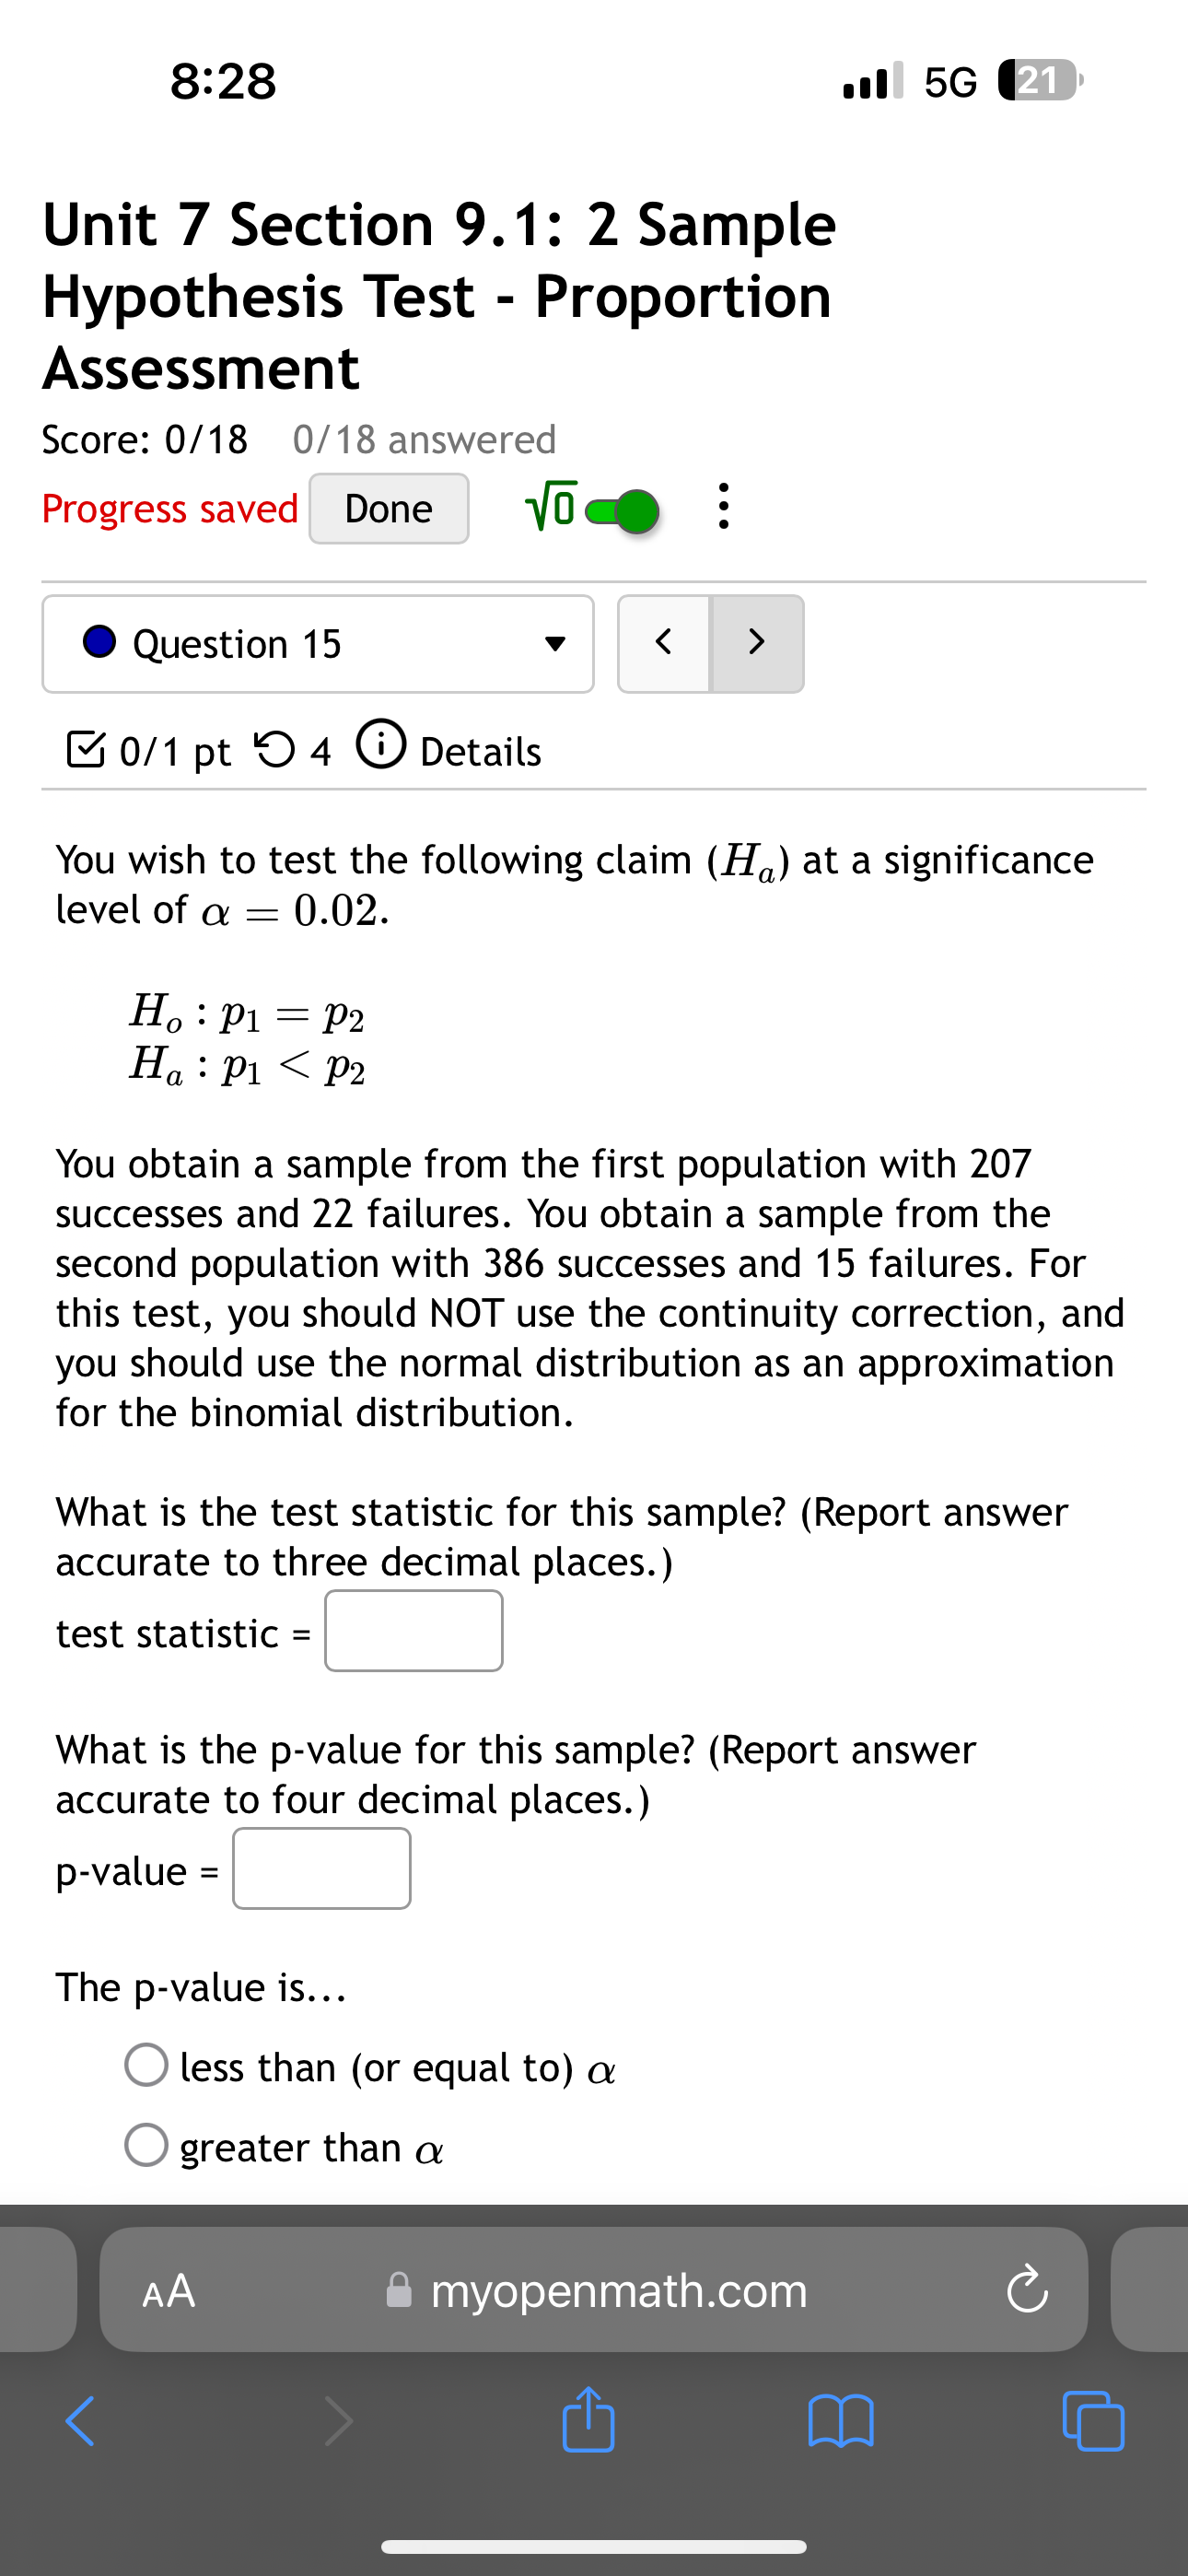
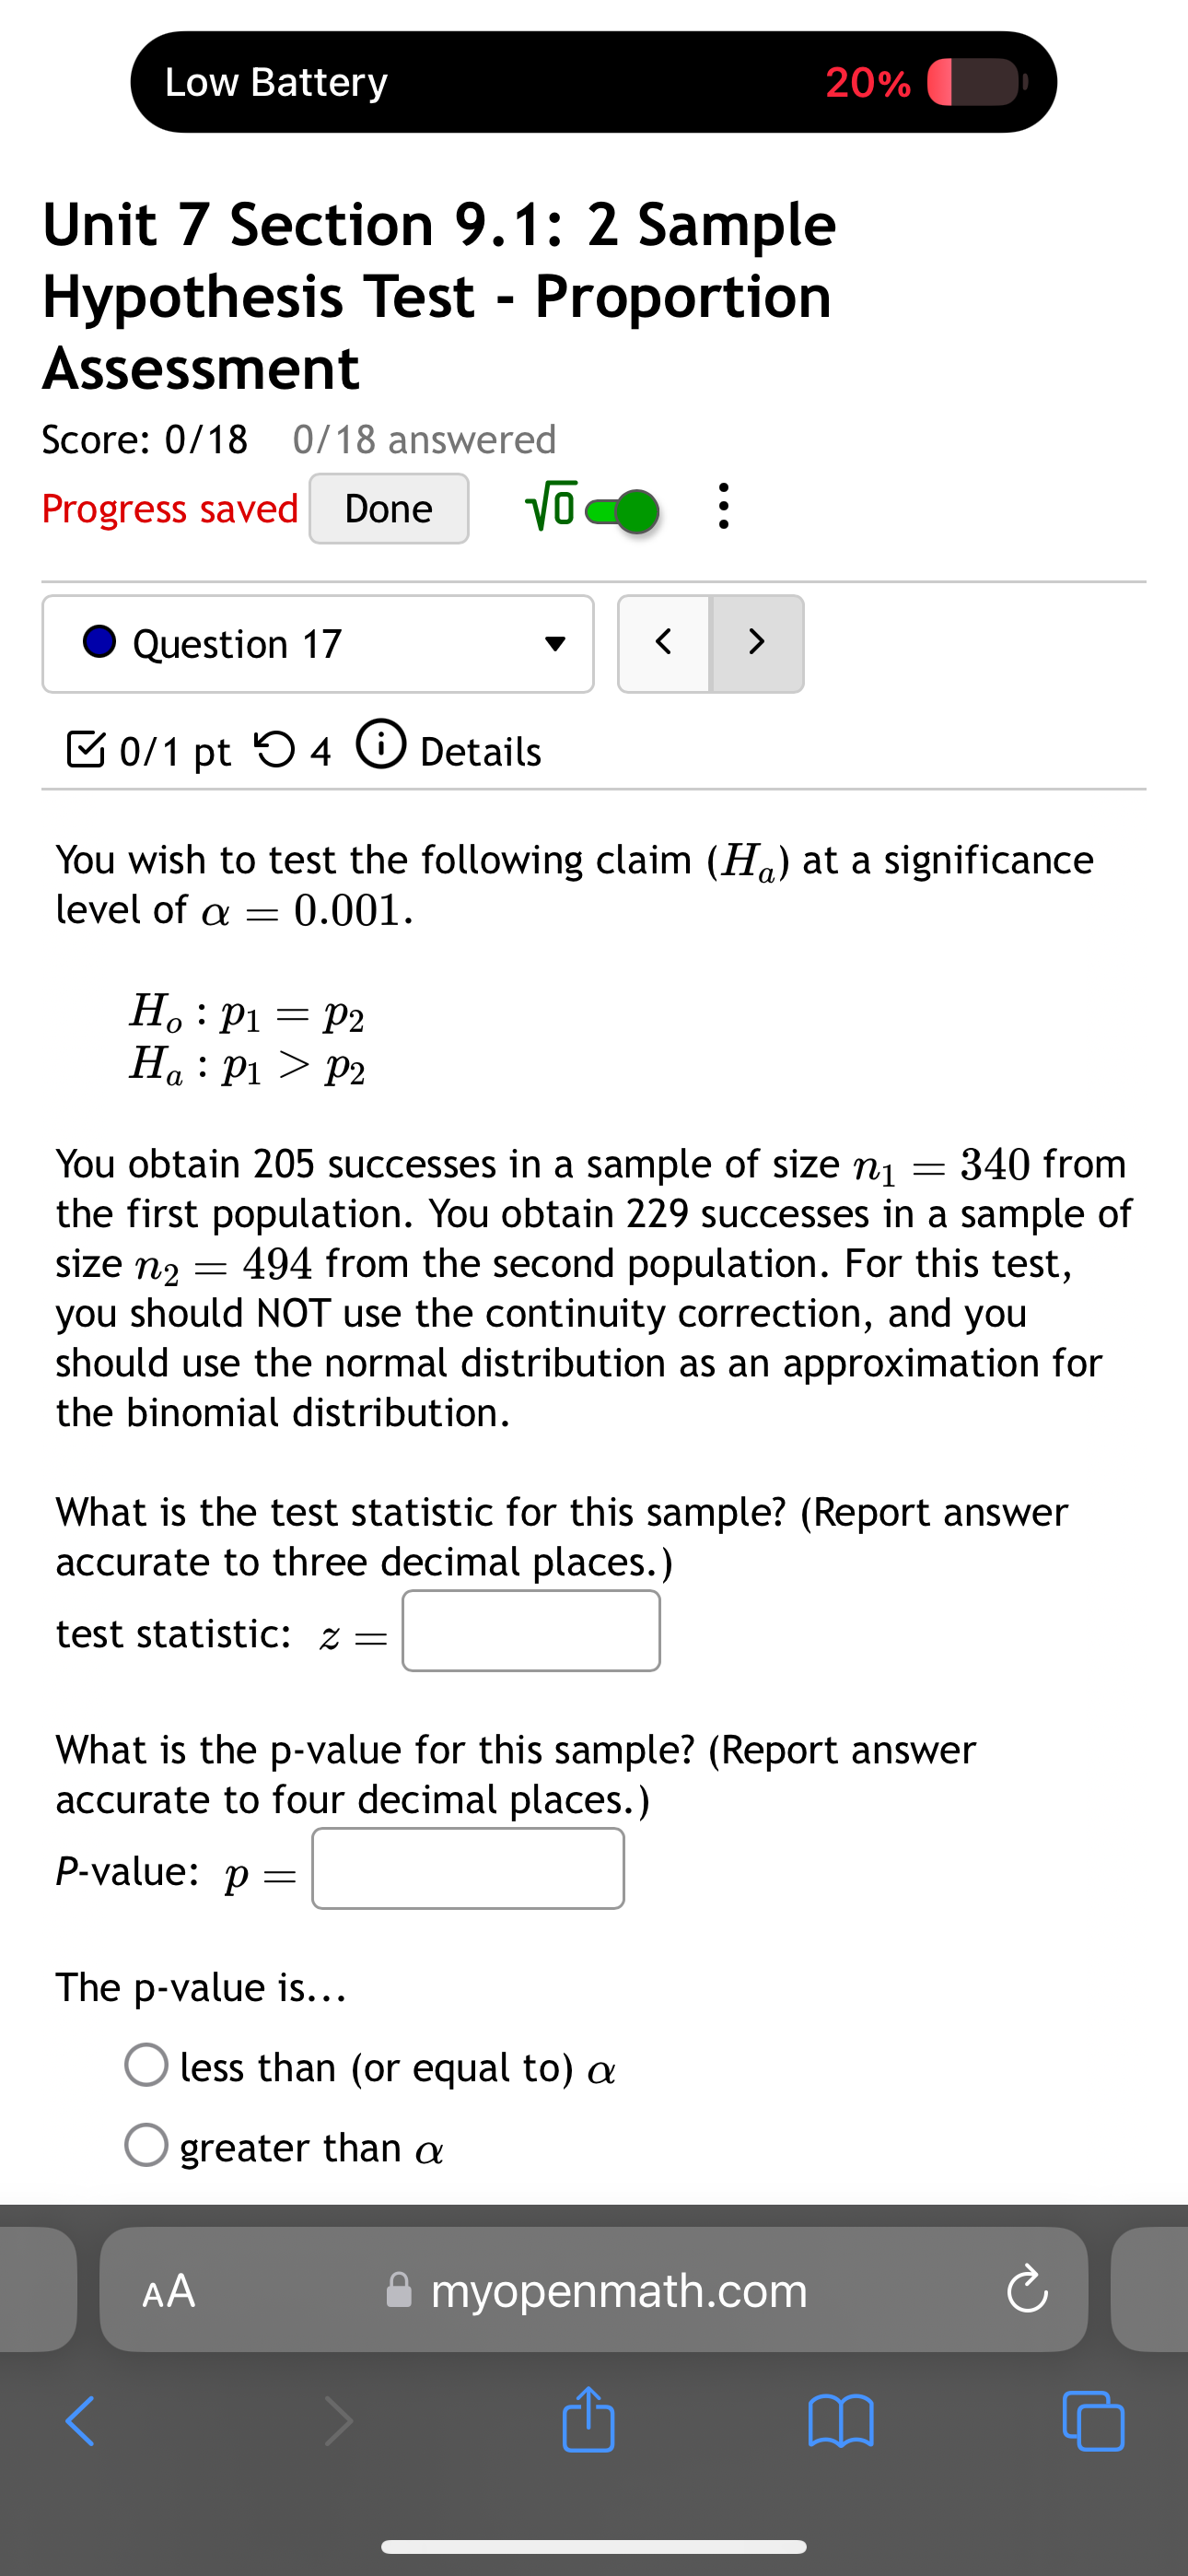
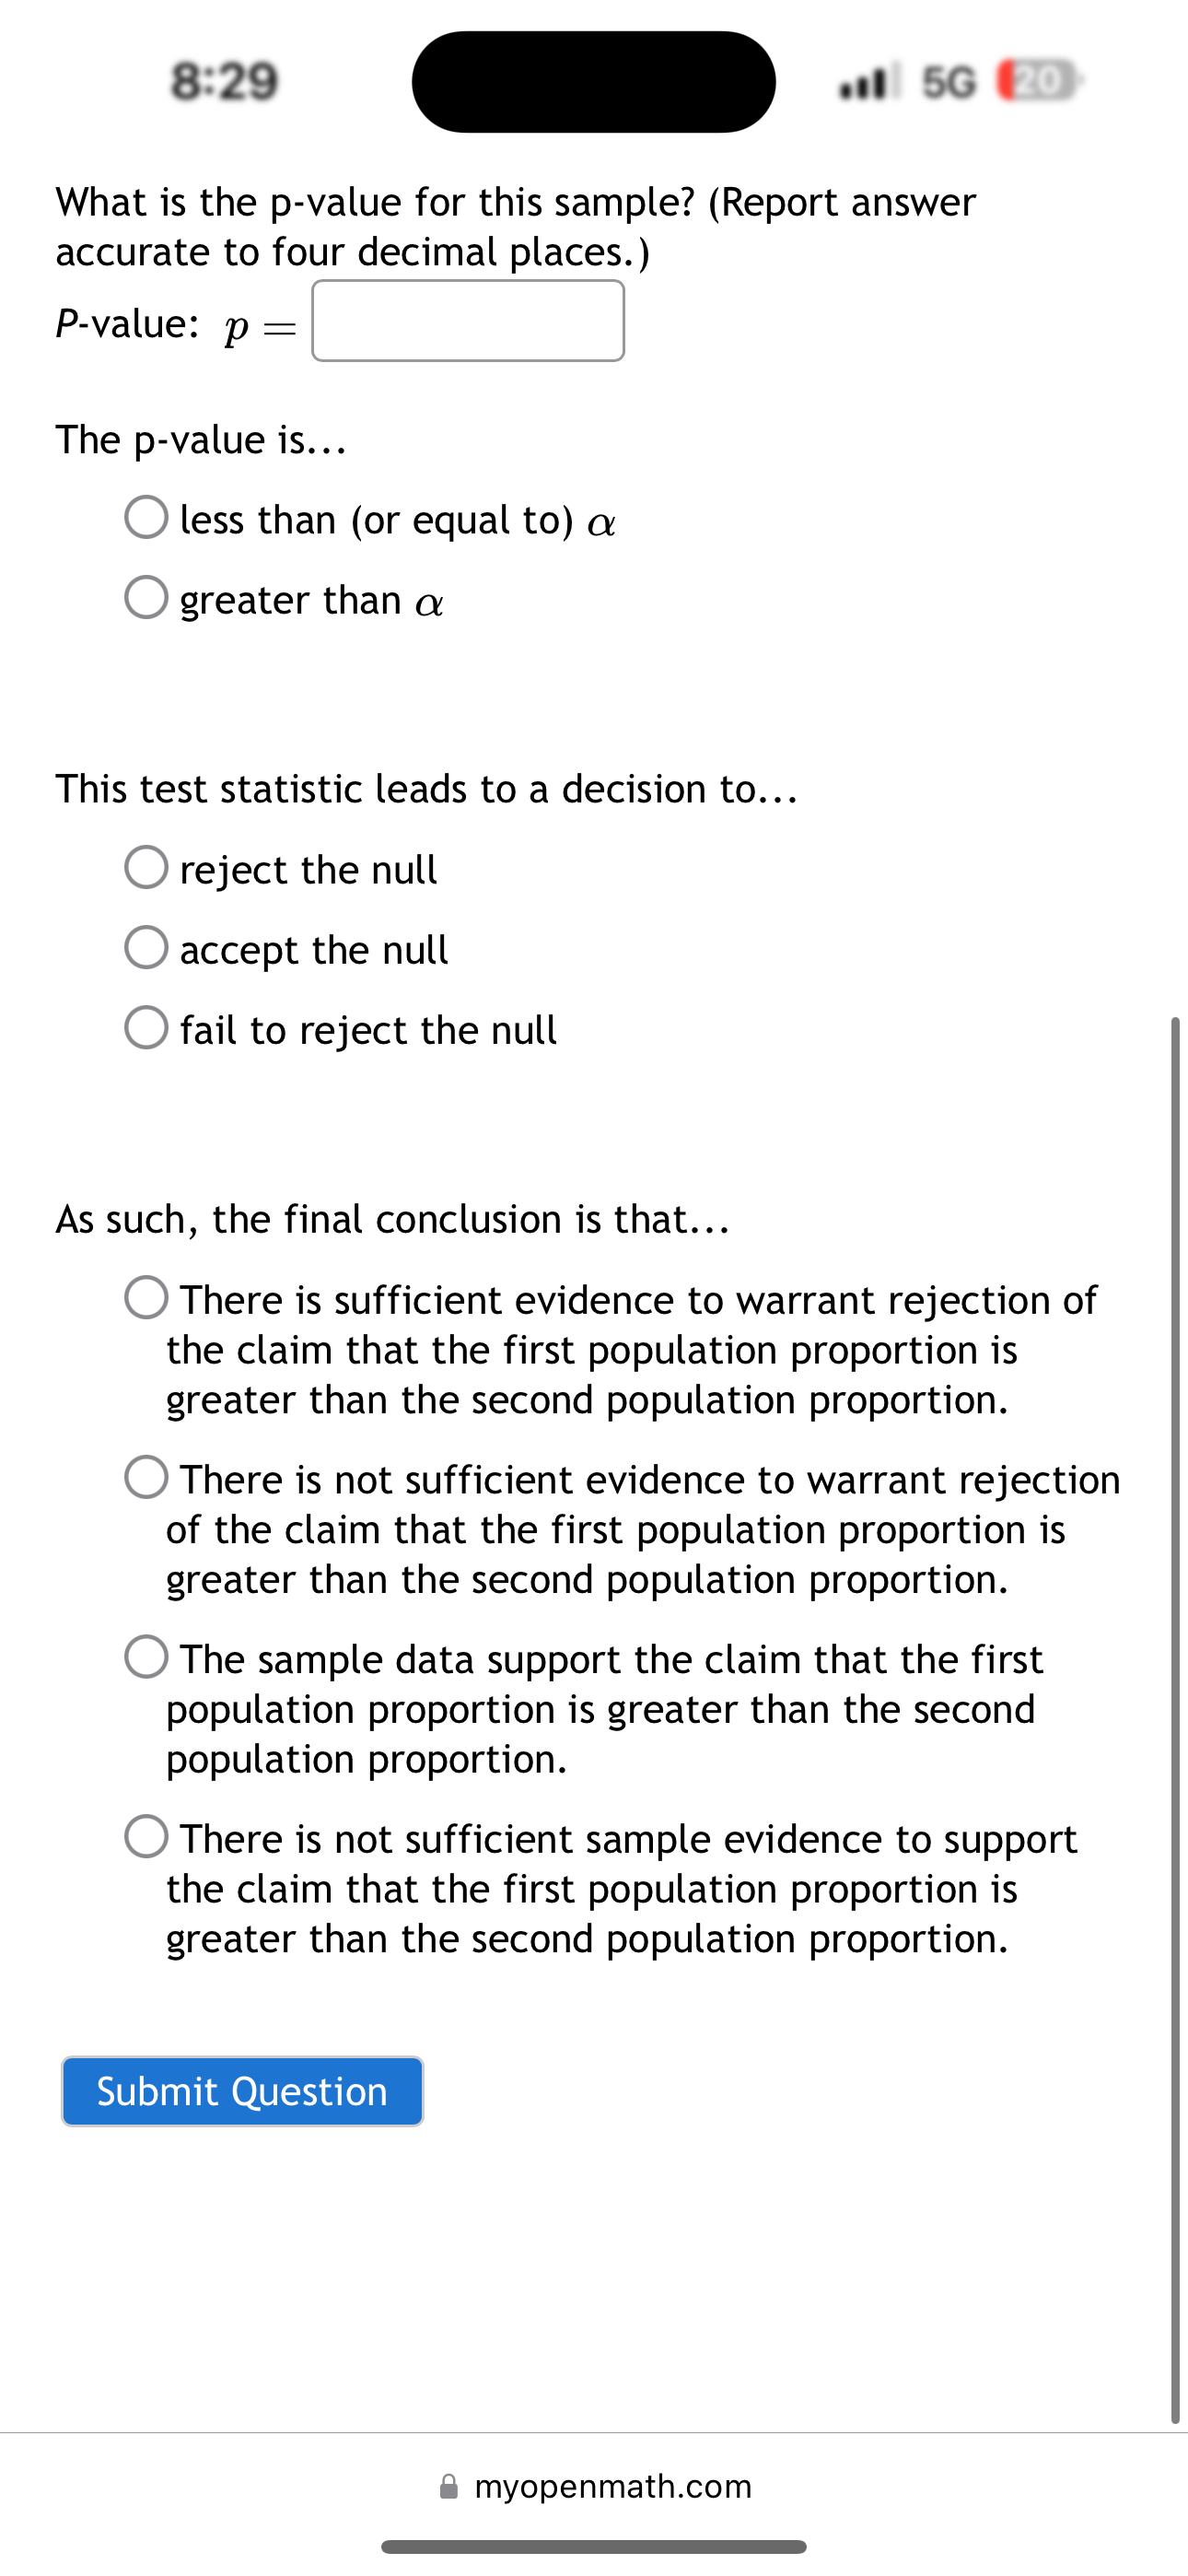
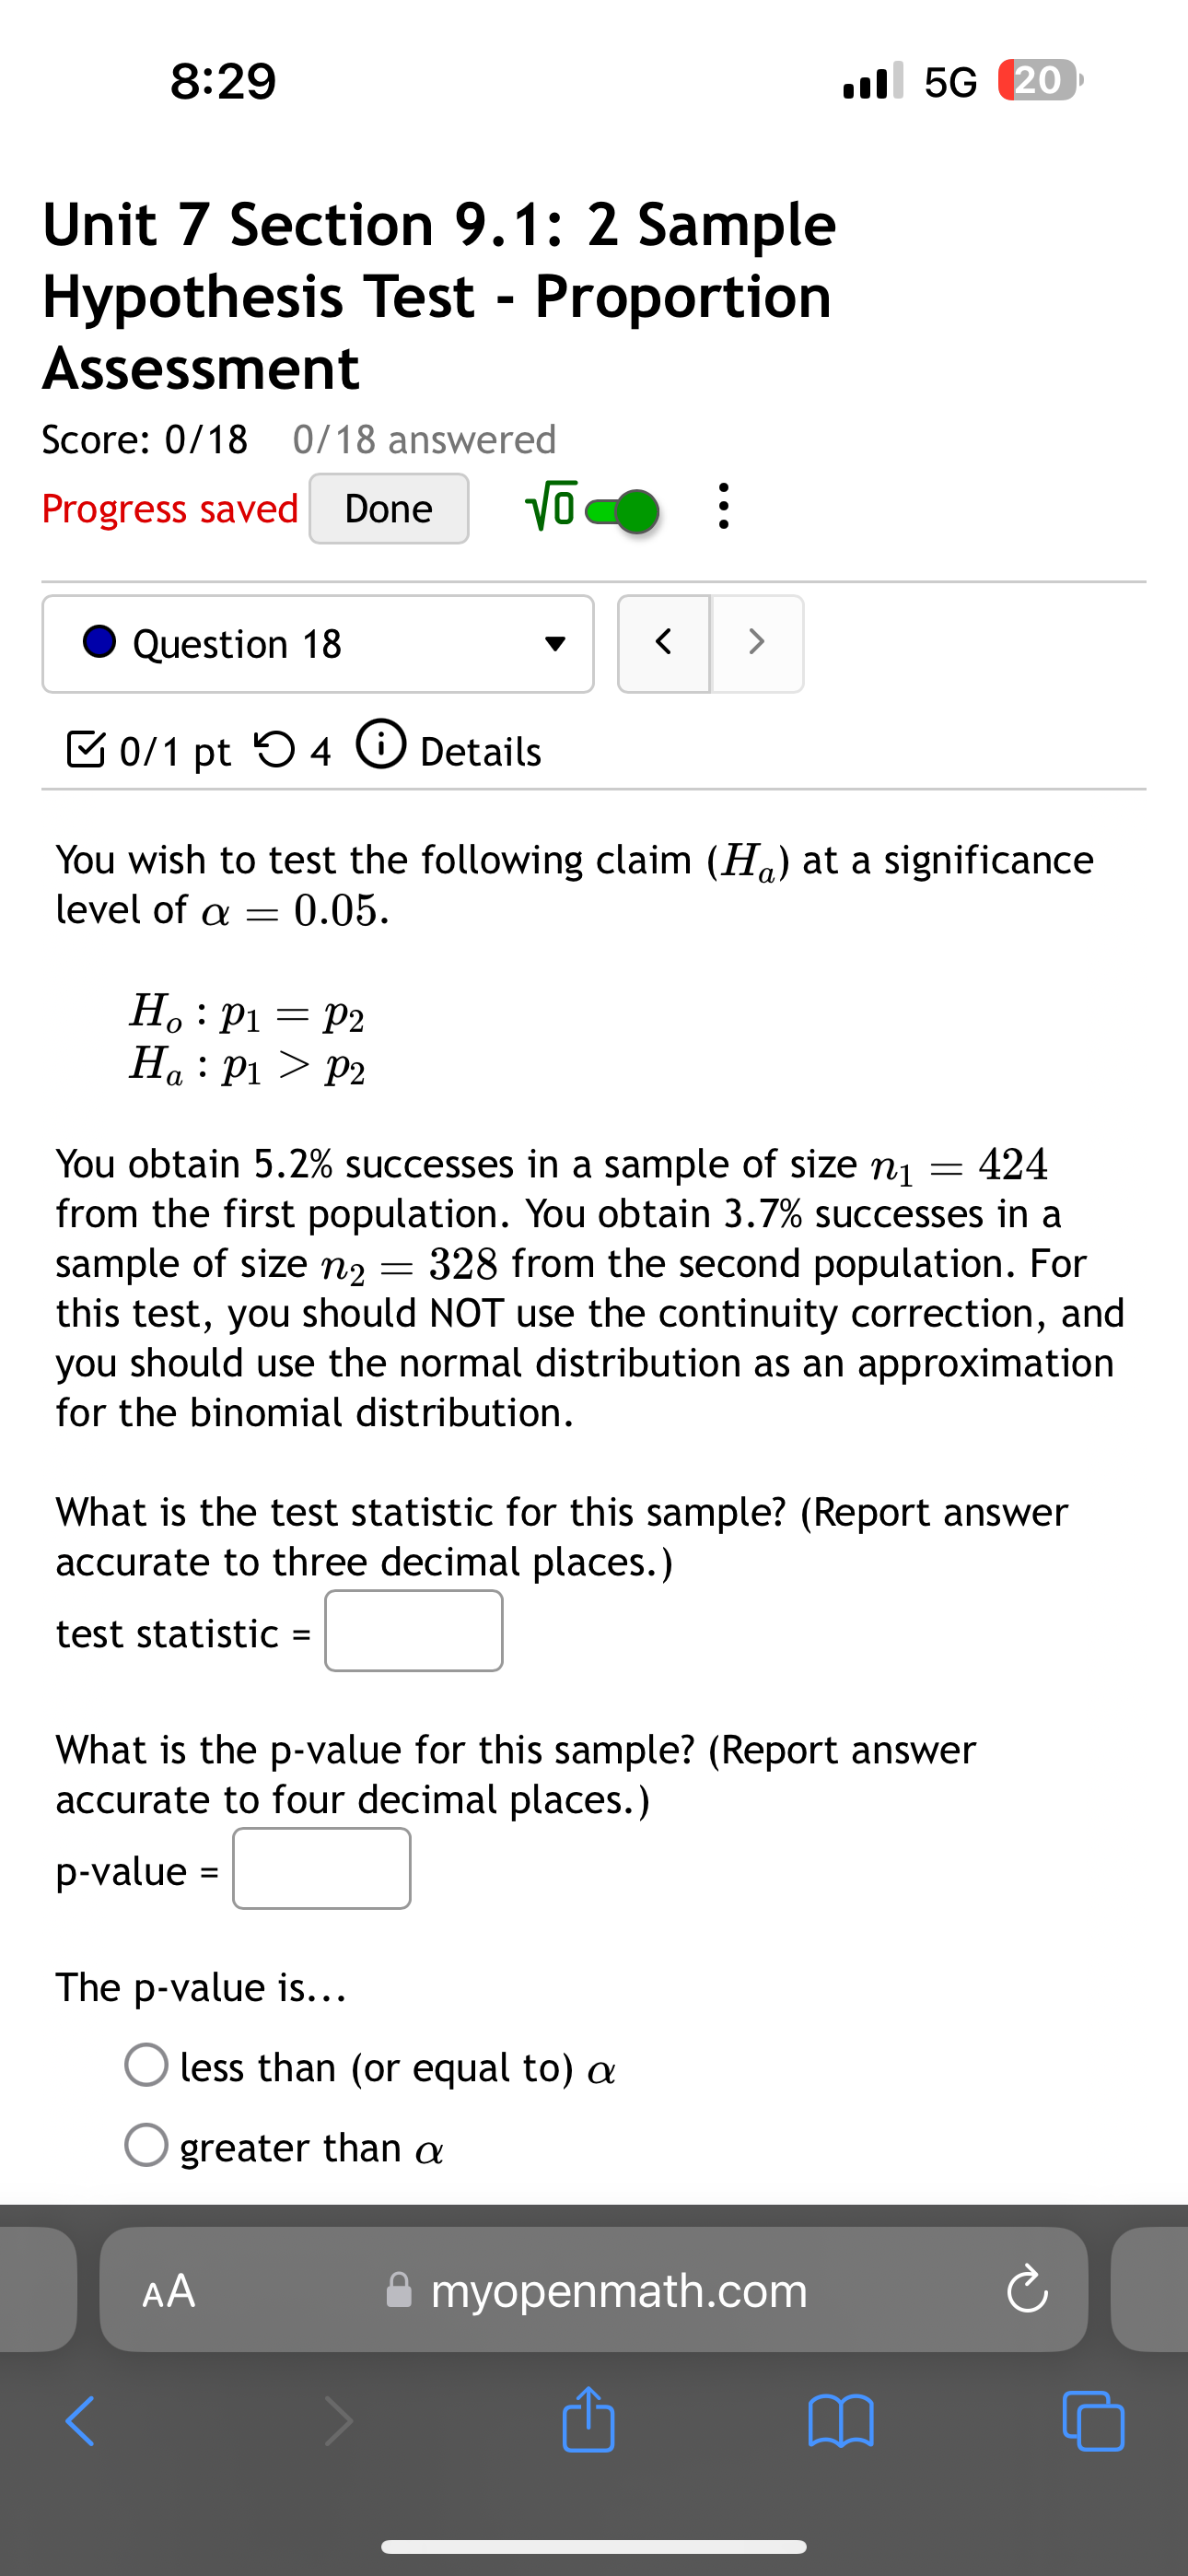
PF H1 : PM / PF H1 : UM MF H1 : PM Mo/1pt D4 @ Details You wish to test the following claim (H,) at a significance level of a = 0.02. H,:p1=p H,:p1 & 0/1 pt O 4 O Details You are testing the claim that the proportion of men who own cats is smaller than the proportion of women who own cats. You sample 80 men, and 50% own cats. You sample 120 women, and 40% own cats. Find the test statistic, rounded to two decimal places. @& myopenmath.com 8:28 a 56 ( Unit 7 Section 9.1: 2 Sample Hypothesis Test - Proportion Assessment Score: 0/18 0/18 answered Progress saved Done Vle@ : @ Question 10 v & 0/1 pt O 4 O Details You are testing the claim that the proportion of men who own cats is larger than the proportion of women who own cats. You sample 180 men, and 85% own cats. You sample 120 women, and 80% own cats. Find the test statistic, rounded to two decimal places. @& myopenmath.com 8:28 .1 5G 21 Progress saved Done Vo . . . Question 11 0/1 pt 9 4 0 Details Test the claim that the proportion of men who own cats is significantly different than the proportion of women who own cats at the 0.1 significance level. The null and alternative hypothesis would be: Ho : UM = UF Ho : PM = PF Ho : MM = MF H1 : UM # UF H1 : PM / PF H1 : UM UF H1 : PM PF O The test is: left-tailed right-tailed two-tailed Based on a sample of 20 men, 30% owned cats Based on a sample of 20 women, 55% owned cats The test statistic is: (to 2 decimals) The p-value is: (to 2 decimals) Based on this we: O Reject the null hypothesis O Fail to reject the null hypothesis myopenmath.com8:28 all 56 ( Score: 0/18 0/18 answered Progress saved Done '\\/ @ @ Question 12 v ~Mo/1pt D4 @ Details You wish to test the following claim (H,) at a significance level of & = 0.001. H,:p1=p H,:p1 > po You obtain 128 successes in a sample of size n; = 402 from the first population. You obtain 163 successes in a sample of size noy 588 from the second population. For this test, you should NOT use the continuity correction, and you should use the normal distribution as an approximation for the binomial distribution. What is the test statistic for this sample? (Report answer accurate to three decimal places.) test statistic: z = What is the p-value for this sample? (Report answer accurate to four decimal places.) P-value: p = The p-value is... O less than (or equal to) o () greater than This test statistic leads to a decision to... O reject the null (O accept the null O fail to reject the null Reader Available 8:28 all 56 ( What is the p-value for this sample? (Report answer accurate to four decimal places.) P-value: p = The p-value is... O less than (or equal to) o O greater than o This test statistic leads to a decision to... O reject the null (O accept the null O fail to reject the null As such, the final conclusion is that... (O There is sufficient evidence to warrant rejection of the claim that the first population proportion is greater than the second population proportion. (O There is not sufficient evidence to warrant rejection of the claim that the first population proportion is greater than the second population proportion. (O The sample data support the claim that the first population proportion is greater than the second population proportion. (O There is not sufficient sample evidence to support the claim that the first population proportion is greater than the second population proportion. Submit Question & myopenmath.com 8:28 all 56 ( Unit 7 Section 9.1: 2 Sample Hypothesis Test - Proportion Assessment Score: 0/18 0/18 answered Progress saved Done Vle@ : @ Question 13 v & 0/1 pt O 4 O Details You wish to test the following claim (H,) at a significance level of a = 0.02. H,:p1=p H,:p1 & 0/1 pt O 4 O Details You wish to test the following claim (H,) at a significance level of a = 0.02. H,:p1=p H,:p1>po You obtain a sample from the first population with 79 successes and 302 failures. You obtain a sample from the second population with 23 successes and 182 failures. For this test, you should NOT use the continuity correction, and you should use the normal distribution as an approximation for the binomial distribution. What is the test statistic for this sample? (Report answer accurate to three decimal places.) test statistic = What is the p-value for this sample? (Report answer accurate to four decimal places.) p-value = The p-value is... O less than (or equal to) o () greater than & myopenmath.com 8:28 all 56 ( What is the p-value for this sample? (Report answer accurate to four decimal places.) p-value = | The p-value is... O less than (or equal to) o O greater than o This test statistic leads to a decision to... O reject the null (O accept the null (O fail to reject the null As such, the final conclusion is that... (O There is sufficient evidence to warrant rejection of the claim that the first population proportion is greater than the second population proportion. (O There is not sufficient evidence to warrant rejection of the claim that the first population proportion is greater than the second population proportion. (O The sample data support the claim that the first population proportion is greater than the second population proportion. (O There is not sufficient sample evidence to support the claim that the first population proportion is greater than the second population proportion. Submit Question & myopenmath.com 8:28 all 56 ( Unit 7 Section 9.1: 2 Sample Hypothesis Test - Proportion Assessment Score: 0/18 0/18 answered Progress saved Done Vle@ : @ Question 15 v & 0/1 pt O 4 O Details You wish to test the following claim (H,) at a significance level of a = 0.02. H,:p1=p H,:p1 & 0/1 pt O 4 O Details You wish to test the following claim (H,) at a significance level of & = 0.01. H,:p1=p H,:p1 ~Mo/1pt D4 @ Details You wish to test the following claim (H,) at a significance level of a = 0.001. H,:p1=p H,:p1>po You obtain 205 successes in a sample of size n; = 340 from the first population. You obtain 229 successes in a sample of size ny = 494 from the second population. For this test, you should NOT use the continuity correction, and you should use the normal distribution as an approximation for the binomial distribution. What is the test statistic for this sample? (Report answer accurate to three decimal places.) test statistic: z = What is the p-value for this sample? (Report answer accurate to four decimal places.) P-value: p = The p-value is... O less than (or equal to) o () greater than & myopenmath.com What is the p-value for this sample? (Report answer accurate to four decimal places.) P-value: p = The p-value is... O less than (or equal to) o O greater than o This test statistic leads to a decision to... O reject the null (O accept the null O fail to reject the null As such, the final conclusion is that... (O There is sufficient evidence to warrant rejection of the claim that the first population proportion is greater than the second population proportion. (O There is not sufficient evidence to warrant rejection of the claim that the first population proportion is greater than the second population proportion. (O The sample data support the claim that the first population proportion is greater than the second population proportion. (O There is not sufficient sample evidence to support the claim that the first population proportion is greater than the second population proportion. Submit Question & myopenmath.com 8:29 all 56 Unit 7 Section 9.1: 2 Sample Hypothesis Test - Proportion Assessment Score: 0/18 0/18 answered Progress saved Done Vle@ : @ Question 18 v & 0/1 pt O 4 O Details You wish to test the following claim (H,) at a significance level of a = 0.05. H,:p1=p H,:p1>po You obtain 5.2% successes in a sample of size n; = 424 from the first population. You obtain 3.7% successes in a sample of size ny = 328 from the second population. For this test, you should NOT use the continuity correction, and you should use the normal distribution as an approximation for the binomial distribution. What is the test statistic for this sample? (Report answer accurate to three decimal places.) test statistic = What is the p-value for this sample? (Report answer accurate to four decimal places.) p-value = The p-value is... O less than (or equal to) o () greater than & myopenmath.com 8:29 all 56 ( What is the p-value for this sample? (Report answer accurate to four decimal places.) p-value = The p-value is... O less than (or equal to) o O greater than o This test statistic leads to a decision to... O reject the null (O accept the null O fail to reject the null As such, the final conclusion is that... (O There is sufficient evidence to warrant rejection of the claim that the first population proportion is greater than the second population proportion. (O There is not sufficient evidence to warrant rejection of the claim that the first population proportion is greater than the second population proportion. (O The sample data support the claim that the first population proportion is greater than the second population proportion. (O There is not sufficient sample evidence to support the claim that the first population proportion is greater than the second population proportion. Submit Question & myopenmath.com
Step by Step Solution
There are 3 Steps involved in it
1 Expert Approved Answer
Step: 1 Unlock
Question Has Been Solved by an Expert!
Get step-by-step solutions from verified subject matter experts
Step: 2 Unlock
Step: 3 Unlock
Students Have Also Explored These Related Mathematics Questions!