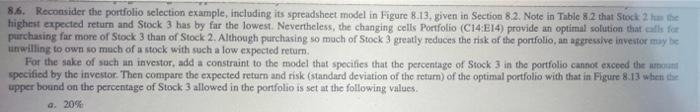
Question: 8.6. Reconsider the portfolio selection example, including its spreadsheet model in Figure 8.13. given in Section 8.2. Note in Table 8.2 that Stock2the highest expected

8.6. Reconsider the portfolio selection example,
8.6. Reconsider the portfolio selection example, including its spreadsheet model in Figure 8.13. given in Section 8.2. Note in Table 8.2 that Stock2the highest expected return and Stock 3 has by far the lowest. Nevertheless, the changing cells Portfolio (C14:E14) provide an optimal solution that calls for purchasing for more of Stock 3 than of Stock 2. Although purchasing so much of Stock 3 greatly reduces the risk of the portfolio, an aggressive investor may be willing to own so much of a stock with such a low expected return For the sake of such an investor, add a constraint to the model that specifies that the percentage of Stock 3 in the portfolio cannot exceed the amount specified by the investor. Then compare the expected return and risk (standard deviation of the return) of the optimal portfolio with that in Figure 8.13 when the upper bound on the percentage of Stock 3 allowed in the portfolio is set at the following values. . 20% se opter Toi Min By Changer Now Spew TO Svetla Moller Soi MedORO Ondarea AL C D o H Rango Nume Cells 1 Portfolio Selection Problem (Nonlinear Programming) Cornel2 09 2 Covar! 19 Stock 1 Stock 21 Stock 3 Cover23 EIO 4 Espected Return 215 30% 8% Covariance C9 611 S ExpectedReturn C19 R(Stand. Dey) 256 45% 5% MinExpected Return E19 OucHundredPerel H14 5 Jolst Risk (Cover) Stock Stock 2 Stock 3 Portfolio C14.14 9 Stock 0.040 -0.005 SDI C6 Suck 2 -0.010 SD2 D6 11 Stock SD3 E6 2 StandDev 023 13 Stock 1 Stock 2 Stock 3 Total 14 C14 Portfolio 2012 2017 Stock! 3811 100% 100% Stock DI 4 16 Minimum Stock3 E14 n Expected StockExpectedReturn C4.64 18 Portfolio Return Stock StandDev C6 E6 19 Expected Return 185 18% Total F14 20 Variance C21 21 RNE (Variance) F 13 Total 23 RII (Stand. Dev) 15.4% TSUM Portfolio B 19 Expected Return -SUMPRODUCT(Stock Expected ctum.Portfolio) 21 Rik Variance) (SDIStecki SD2Stock272 SD Stod3242"Cova 12 Std Stock272"Covar)Stocklot2Cara2 22 23 Ruk Stand. Der SORT(Vermice) Sladk2'da FIGURE 8.13 tion cumni of nonlinear programming, where the changing cells Portfolio (C14:E14) give the optimal TABLE 8.2 Data for the Stocks of the Portfolio Selection Example Joint Risk Risk (Standard Deviation) per Stock Stock Expected Return Pair of Stocks (Covariance) 1 2 3 21% 30 8 25% 45 5 1 and 2 1 and 3 2 and 3 0.040 -0.005 -0.010

Step by Step Solution

There are 3 Steps involved in it

1 Expert Approved Answer
Step: 1 Unlock blur-text-image
Question Has Been Solved by an Expert!

Get step-by-step solutions from verified subject matter experts

Step: 2 Unlock
Step: 3 Unlock

Students Have Also Explored These Related General Management Questions!