

Question: 8-6. Show work on excel. Explain. 8-6 EXPECTED RETURNS Stocks A and B have the following probability distributions of expected future returns: Probability 0.1 0.2
8-6. Show work on excel. Explain. 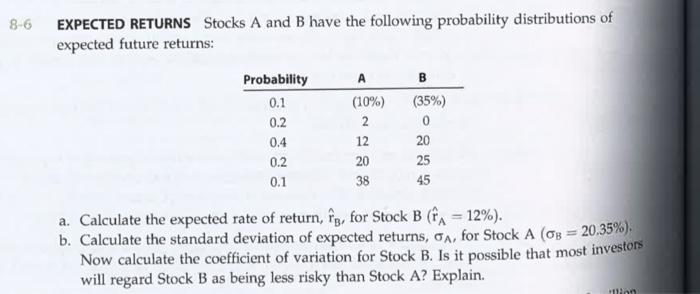
8-6 EXPECTED RETURNS Stocks A and B have the following probability distributions of expected future returns: Probability 0.1 0.2 0.4 0.2 0.1 (10%) 2 12 20 38 B (35%) 0 20 25 45 a. Calculate the expected rate of return, fg, for Stock B (A = 12%). b. Calculate the standard deviation of expected returns, 6A, for Stock A (OB = 20,35%). Now calculate the coefficient of variation for Stock B. Is it possible that most investors will regard Stock B as being less risky than Stock A? Explain
Step by Step Solution
There are 3 Steps involved in it
1 Expert Approved Answer
Step: 1 Unlock

Question Has Been Solved by an Expert!
Get step-by-step solutions from verified subject matter experts
Step: 2 Unlock
Step: 3 Unlock