

Question: Click here to read the eBook: Stand-Alone Risk EXPECTED RETURNS Stocks A and B have the following probability distributions of expected future returns: Probability 0.2
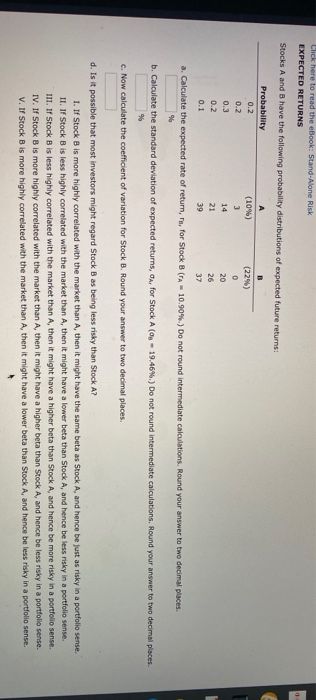
Click here to read the eBook: Stand-Alone Risk EXPECTED RETURNS Stocks A and B have the following probability distributions of expected future returns: Probability 0.2 0.2 0.3 0.2 0.1 (10%) 3 14 21 39 (22%) 0 20 26 37 a. Calculate the expected rate of return, in, for Stock B (A - 10.90%.) Do not round intermediate calculations. Round your answer to two decimal places b. Calculate the standard deviation of expected returns, ca, for Stock A (og - 19.46%.) Do not round intermediate calculations. Round your answer to two decimal places. %% c. Now calculate the coefficient of variation for Stock B. Round your answer to two decimal places d. Is it possible that most investors might regard Stock B as being less risky than Stock A? 1. If Stock B is more highly correlated with the market than A, then it might have the same beta as Stock A, and hence be just as risky in a portfolio sense. II. If Stock B is less highly correlated with the market than A, then it might have a lower beta than Stock A, and hence be less risky in a portfolio sense. III. If Stock B is less highly correlated with the market than A, then it might have a higher beta than Stock A, and hence be more risky in a portfolio sense. IV. If Stock B is more highly correlated with the market than A then it might have a higher beta than Stock A, and hence be less risky in a portfolio sense. V. If Stock B is more highly correlated with the market than A, then it might have a lower beta than Stock A, and hence be less risky in a portfolio sense
Step by Step Solution
There are 3 Steps involved in it

Get step-by-step solutions from verified subject matter experts