

Question: .............. (88 points) The following diagram shows a boxplot for the lifetimes (in months) of a sample of 30 light bulbs. l 5 1 m
..............
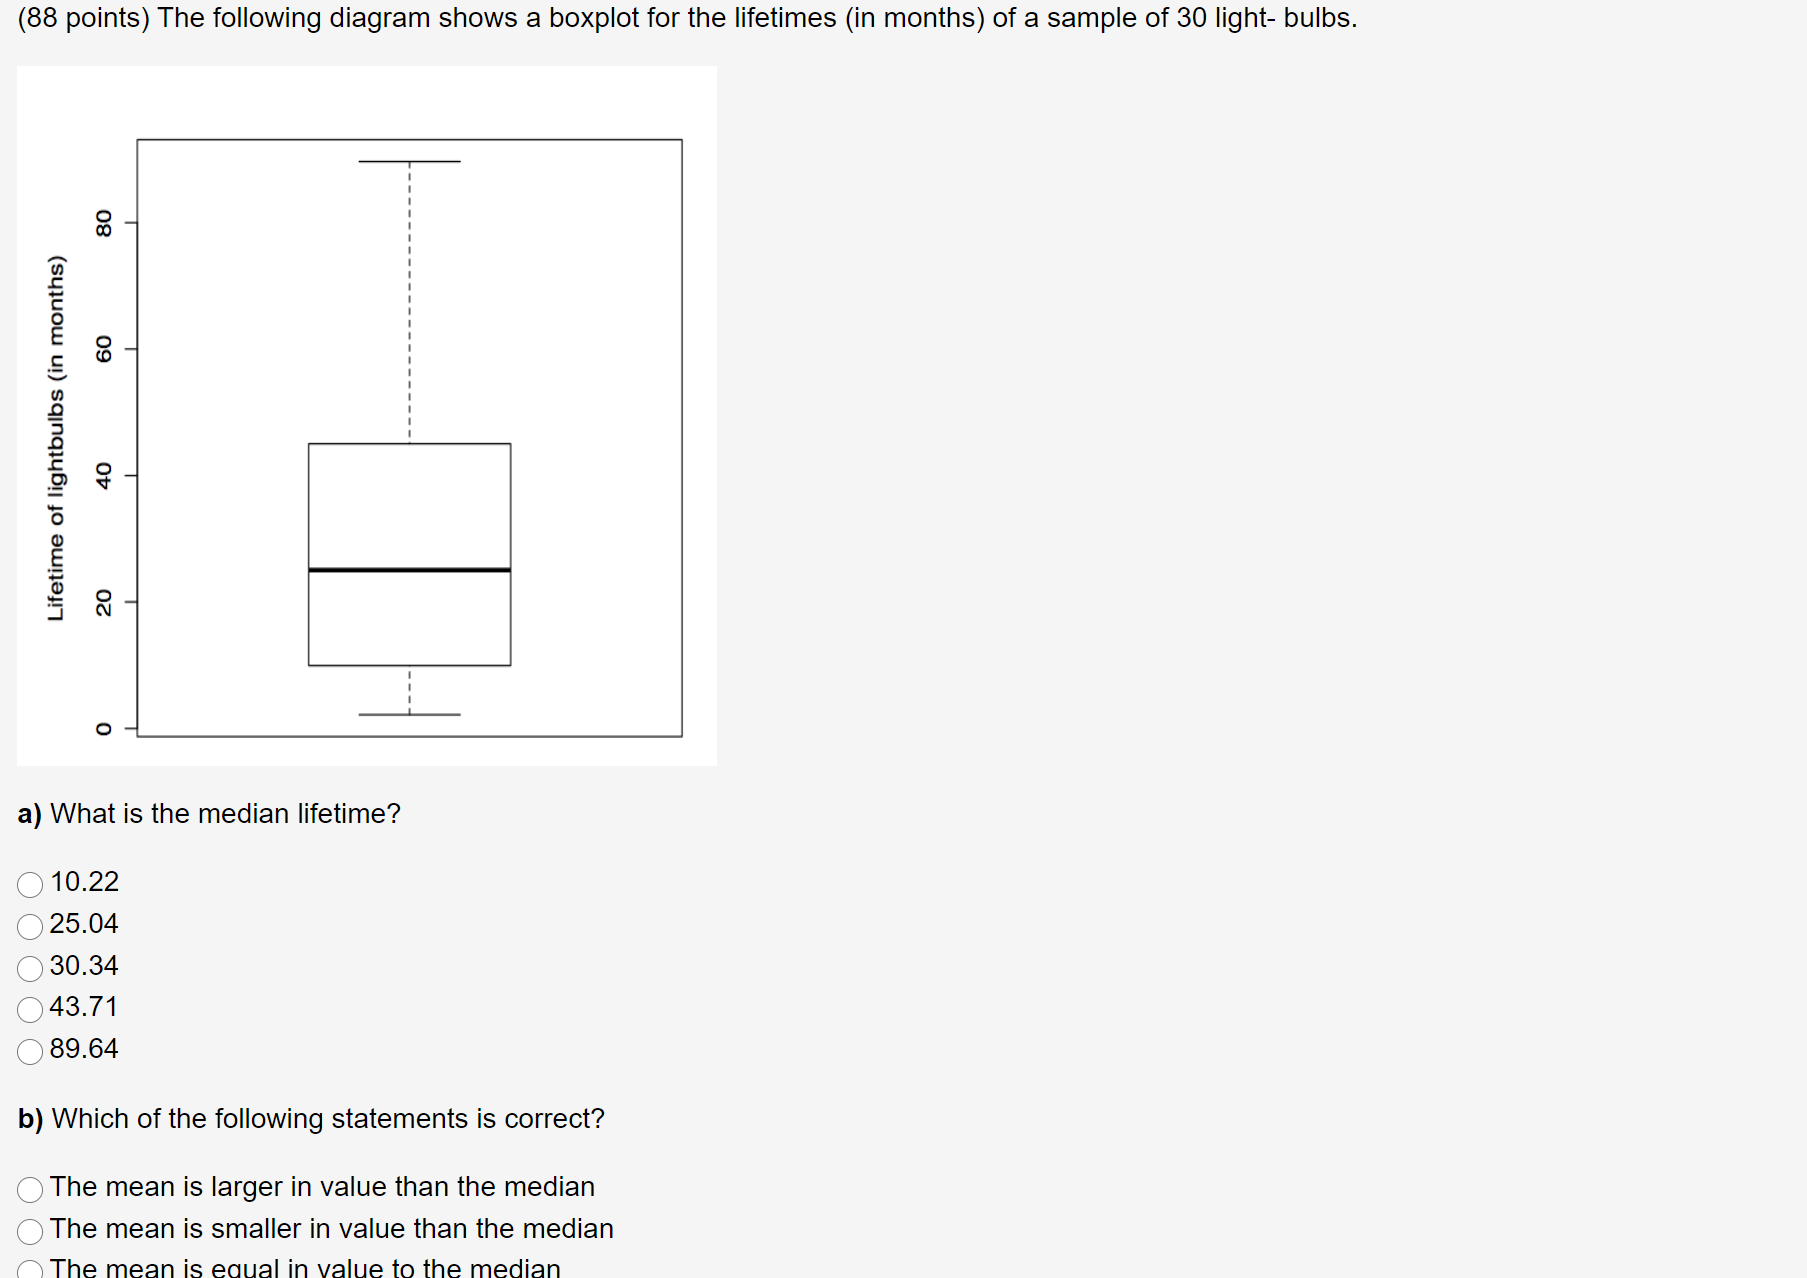
(88 points) The following diagram shows a boxplot for the lifetimes (in months) of a sample of 30 light bulbs. l 5 1 m l I 'm' l .I: l E l o l E o : c '5 . 5 I in I .9 v = l .D E o g Vt '6 O E u g o - _| N l _l_ O a) What is the median lifetime? 0 10.22 0 25.04 0 30.34 0 43.71 0 89.64 b) Which of the following statements is correct? 0 The mean is larger in value than the median Q The mean is smaller in value than the median O The mean is eoual in value to the median a) What is the median lifetime? O 10.22 25.04 30.34 43.71 89.64 b) Which of the following statements is correct? O The mean is larger in value than the median O The mean is smaller in value than the median O The mean is equal in value to the median O There is insufficient information to make a comparison of the mean and median
Step by Step Solution
There are 3 Steps involved in it

Get step-by-step solutions from verified subject matter experts