

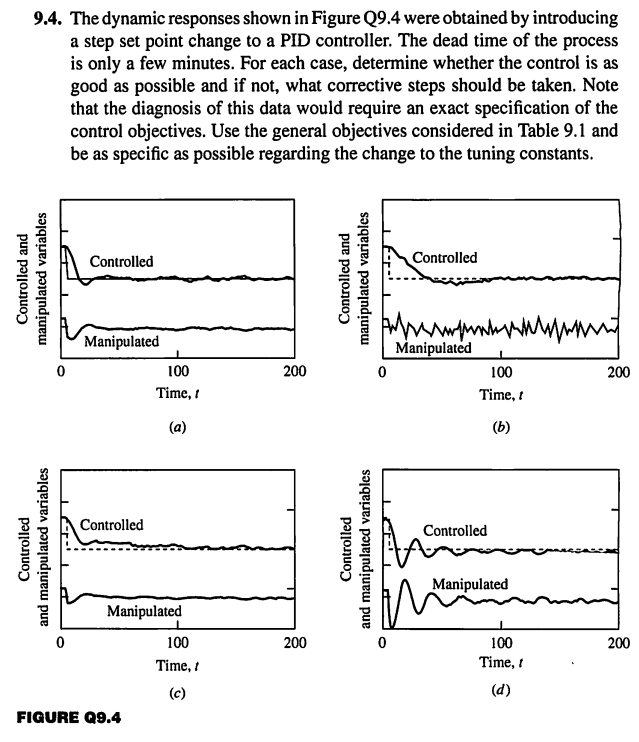
Question: 9 . 4 . The dynamic responses shown in Figure Q 9 . 4 were obtained by introducing a step set point change to a
The dynamic responses shown in Figure Q were obtained by introducing a step set point change to a PID controller. The dead time of the process is only a few minutes. For each case, determine whether the control is as good as possible and if not, what corrective steps should be taken. Note that the diagnosis of this data would require an exact specification of the control objectives. Use the general objectives considered in Table and be as specific as possible regarding the change to the tuning constants.
Step by Step Solution
There are 3 Steps involved in it
1 Expert Approved Answer
Step: 1 Unlock

Question Has Been Solved by an Expert!
Get step-by-step solutions from verified subject matter experts
Step: 2 Unlock
Step: 3 Unlock