

Question: 9) Examine the chart below of expected returns versus standard deviation: 18.0096 T 16.00% 14.00% 12.00% 10.00% 8.00% 6.00% 4.00% 2.00% Portfolio C Portfolio B
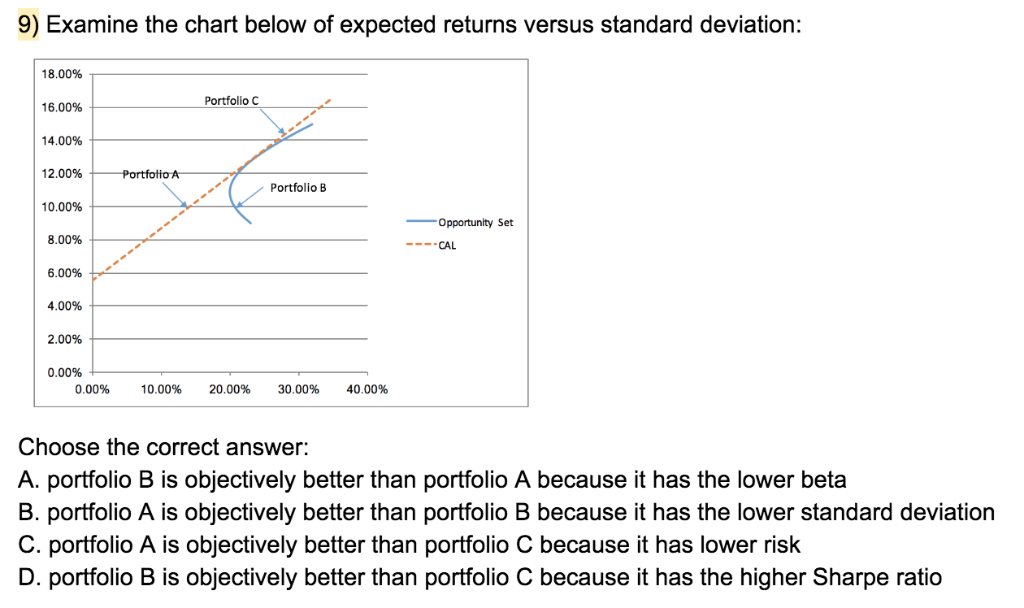
9) Examine the chart below of expected returns versus standard deviation: 18.0096 T 16.00% 14.00% 12.00% 10.00% 8.00% 6.00% 4.00% 2.00% Portfolio C Portfolio B Opportunity Set CAL 0.00% 10.00% 20.00% 30.00% 40.00% Choose the correct answer: A. portfolio B is objectively better than portfolio A because it has the lower beta B. portfolio A is objectively better than portfolio B because it has the lower standard deviation C. portfolio A is objectively better than portfolio C because it has lower risk D. portfolio B is objectively better than portfolio C because it has the higher Sharpe ratio
Step by Step Solution
There are 3 Steps involved in it
1 Expert Approved Answer
Step: 1 Unlock

Question Has Been Solved by an Expert!
Get step-by-step solutions from verified subject matter experts
Step: 2 Unlock
Step: 3 Unlock