

Question: Examine the chart below of expected returns versus standard deviation: Choose the correct answer: A. portfolio A is the optimal risky portfolio B. portfolio B
Examine the chart below of expected returns versus standard deviation:
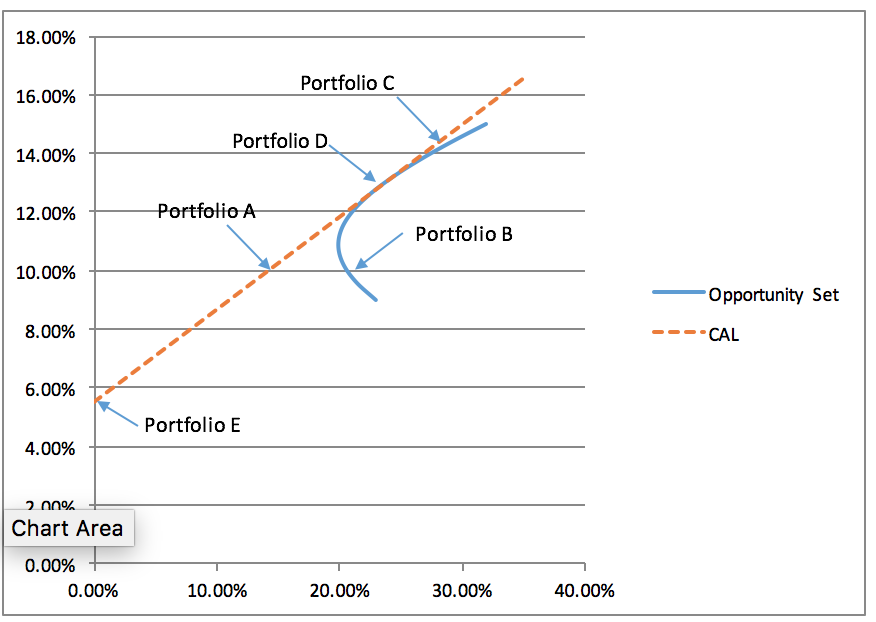
Choose the correct answer:
A. portfolio A is the optimal risky portfolio
B. portfolio B is the minimum variance portfolio
C. portfolio E is 100% investment in the optimal risky asset
D. portfolio C is greater than 100% investment in the optimal risky asset
Examine the chart below of expected returns versus standard deviation:

Choose the correct answer:
A. portfolio A is the optimal risky portfolio
B. portfolio B is the minimum variance portfolio
C. portfolio E is 100% investment in the optimal risky asset
D. portfolio D is 100% investment in the risk-free asset
18.00% Portfolio C 16.00% Portfolio D 14.00% PortfolioA 12.00% Portfolio B 10.00% Opportunity Set CAL 8.00% 6.00% Portfolio E 4.00% Chart Area 0.00% 0.00% 10.00% 20.00% 30.00% 40.00% 18.00% Portfolio C 16.00% Portfolio D 14.00% PortfolioA 12.00% Portfolio B 10.00% Opportunity Set CAL 8.00% 6.00% Portfolio E 4.00% Chart Area 0.00% 0.00% 10.00% 20.00% 30.00% 40.00%
Step by Step Solution
There are 3 Steps involved in it

Get step-by-step solutions from verified subject matter experts