

Question: 9. Heat maps use to convey data values on an image or diagram. A Size B. Color C. Scaling D. Perspective E. Position 10. In
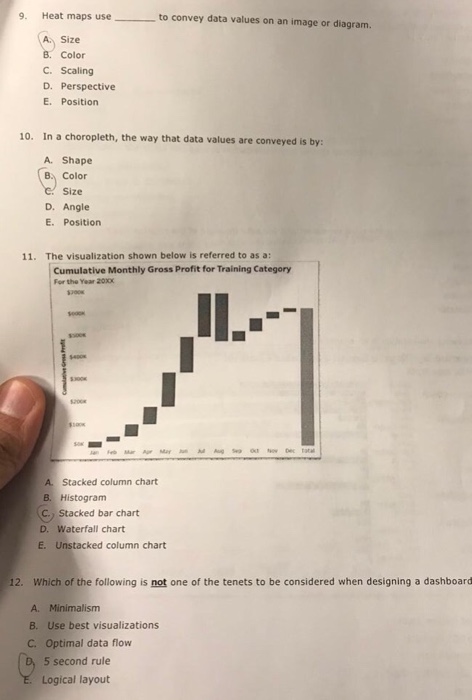
9. Heat maps use to convey data values on an image or diagram. A Size B. Color C. Scaling D. Perspective E. Position 10. In a choropleth, the way that data values are conveyed is by: A. Shape B Color Size D. Angle E. Position 11. The visualization shown below is referred to as a: Cumulative Monthly Gross Profit for Training Category For the Year 20xx A Stacked column chart B. Histogram C., Stacked bar chart D. Waterfall chart E. Unstacked column chart Which of the following is not one of the tenets to be considered when designing a dashboard A. Minimalism B. Use best visualizations C. Optimal data flow D, 5 second rule 12. Logical layout
Step by Step Solution
There are 3 Steps involved in it

Get step-by-step solutions from verified subject matter experts