

Question: 9. I need help on b section 9. An article wanted to look at the compression strength of aluminum cans filled with strawberry drink and
9. I need help on "b" section
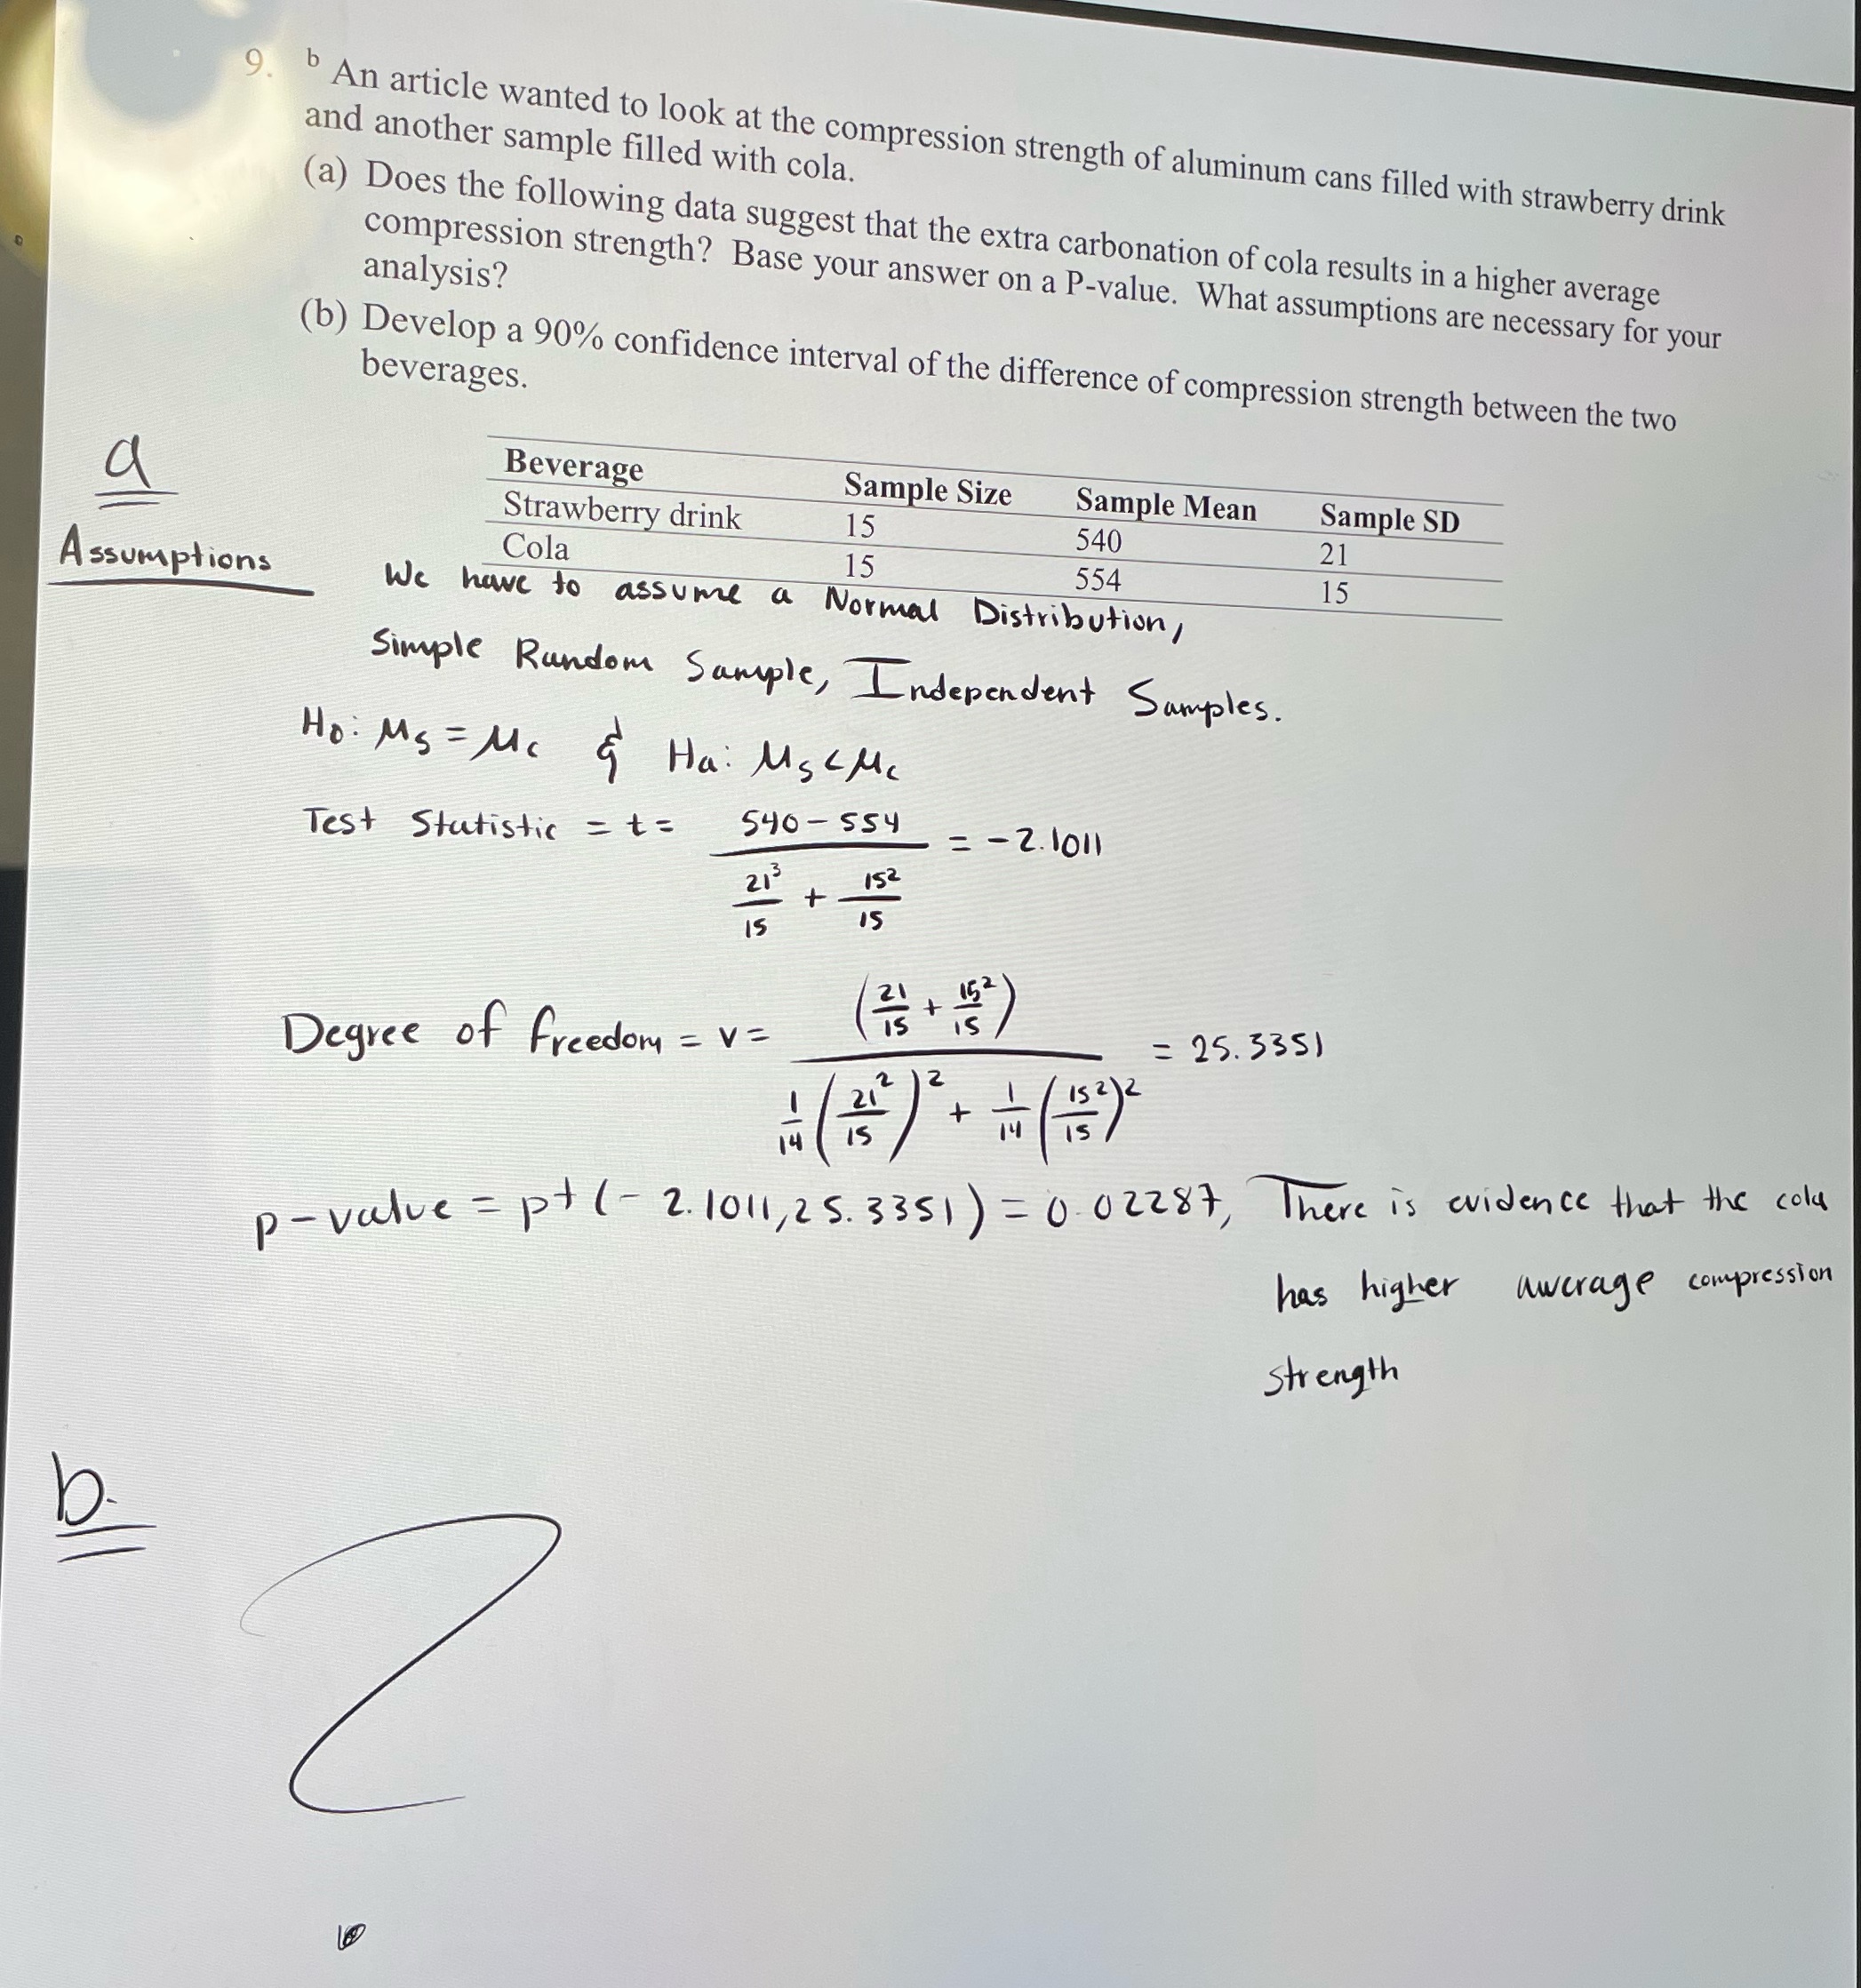
9. An article wanted to look at the compression strength of aluminum cans filled with strawberry drink and another sample filled with cola. (a) Does the following data suggest that the extra carbonation of cola results in a higher average compression strength? Base your answer on a P-value. What assumptions are necessary for your analysis? (b) Develop a 90% confidence interval of the difference of compression strength between the two beverages. Beverage Sample Size Sample Mean Sample SD Strawberry drink 15 540 21 Cola 15 554 15 Assumptions We have to assume a Normal Distribution, Simple Random Sample, Independent Samples. Ho: My = Mc 5 Ha: MSCMc Test Statistic = t = 540- 554 - - 2.1011 152 IS (75 + 152 ) Degree of freedom = v = = 25. 335) p - value = p+ ( - 2. 1011, 2 5. 3 351 ) = 0. 02287, There is evidence that the cola has higher awcrage compression strength
Step by Step Solution
There are 3 Steps involved in it

Get step-by-step solutions from verified subject matter experts