

Question: An article includes the accompanying data on compression strength (Ib) for a sample of 12-oz aluminum cans filled with strawberry drink and another sample filled

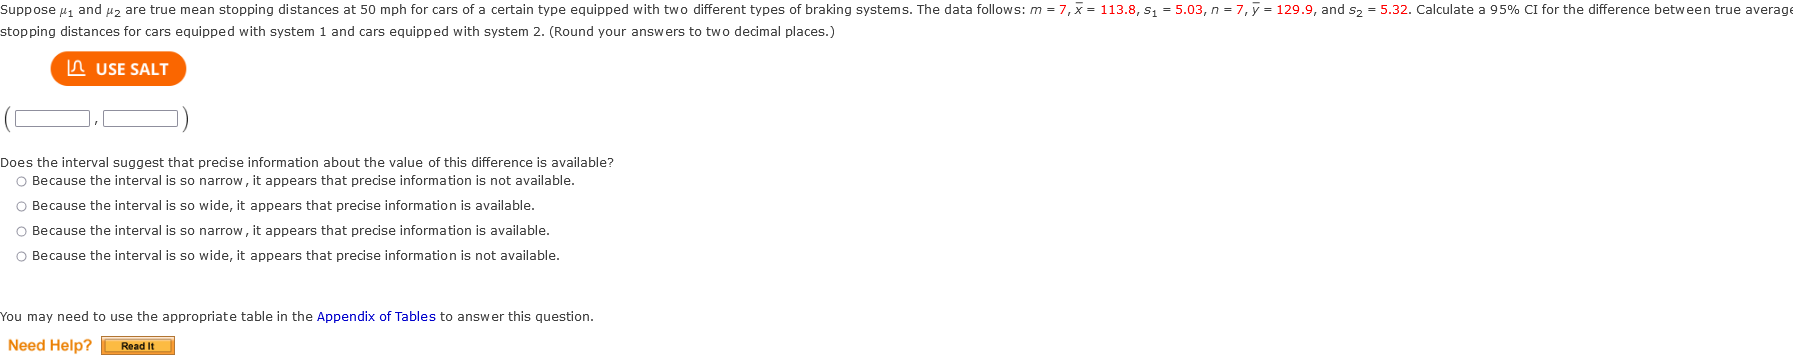

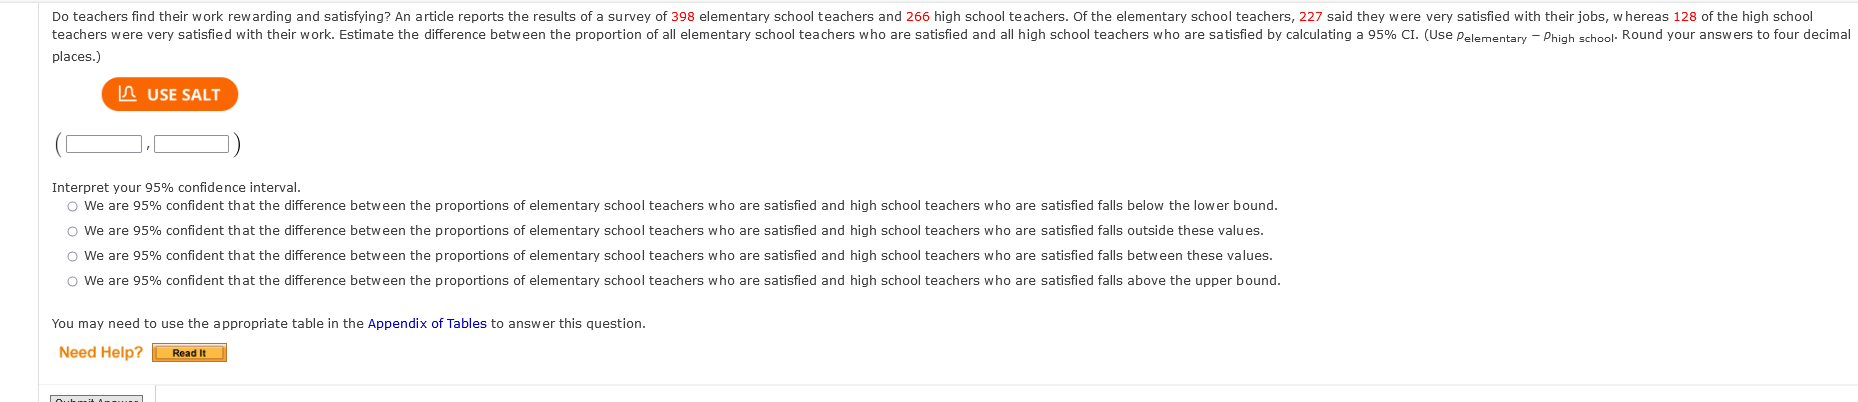

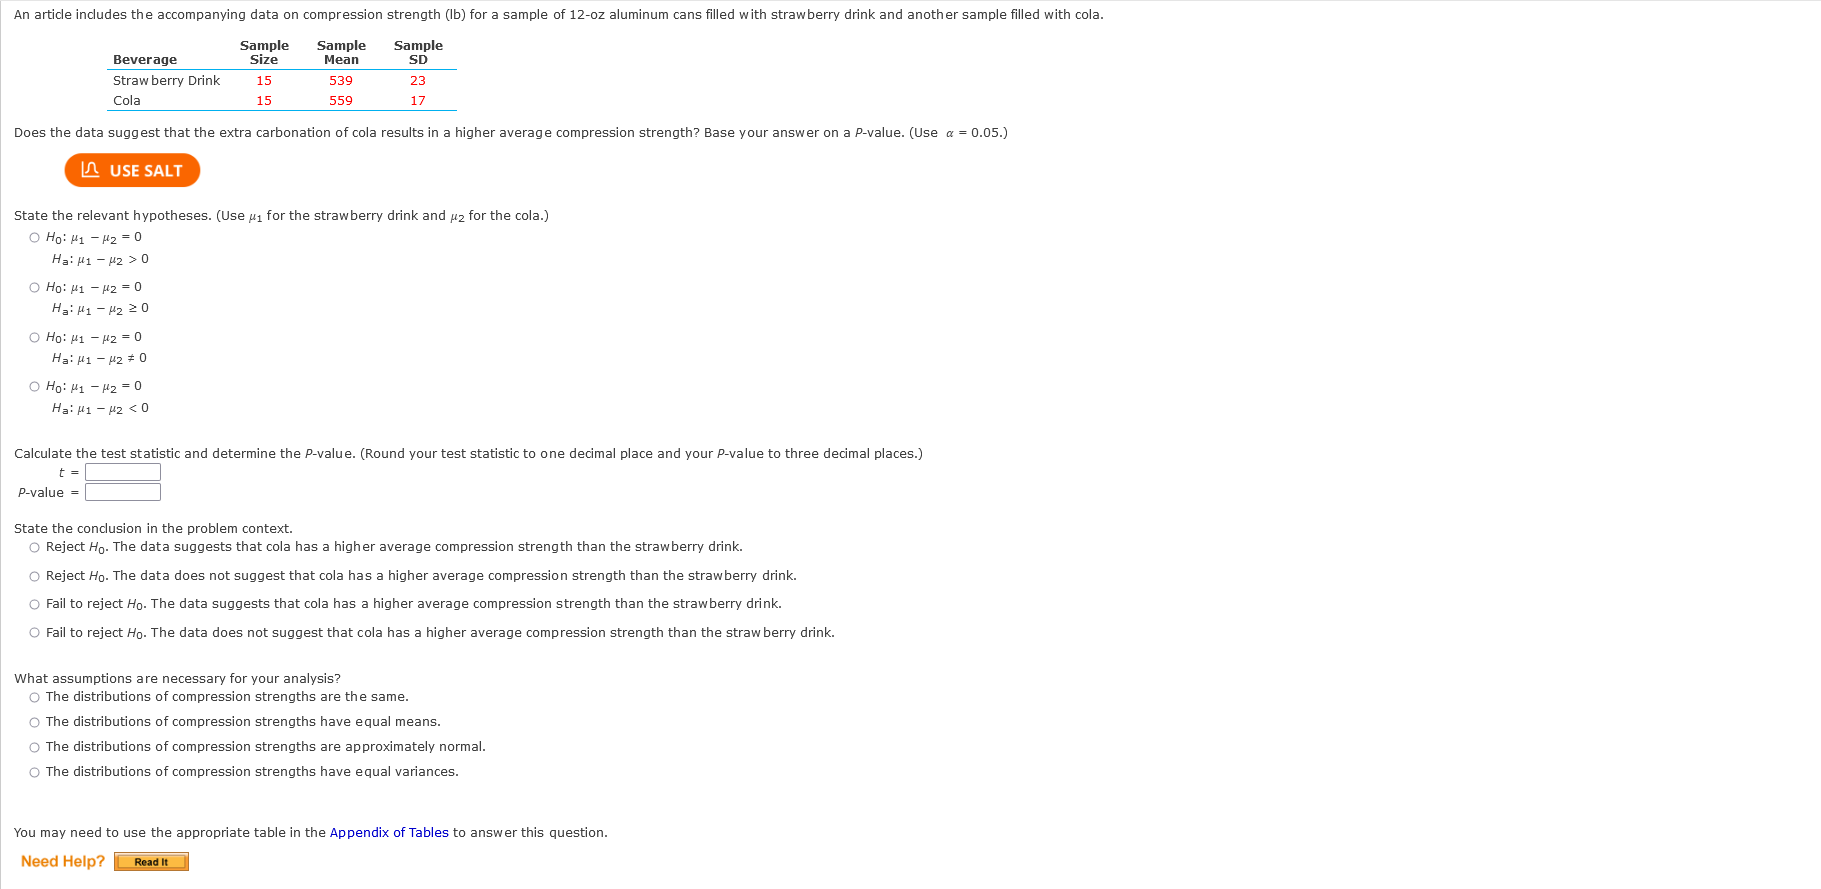

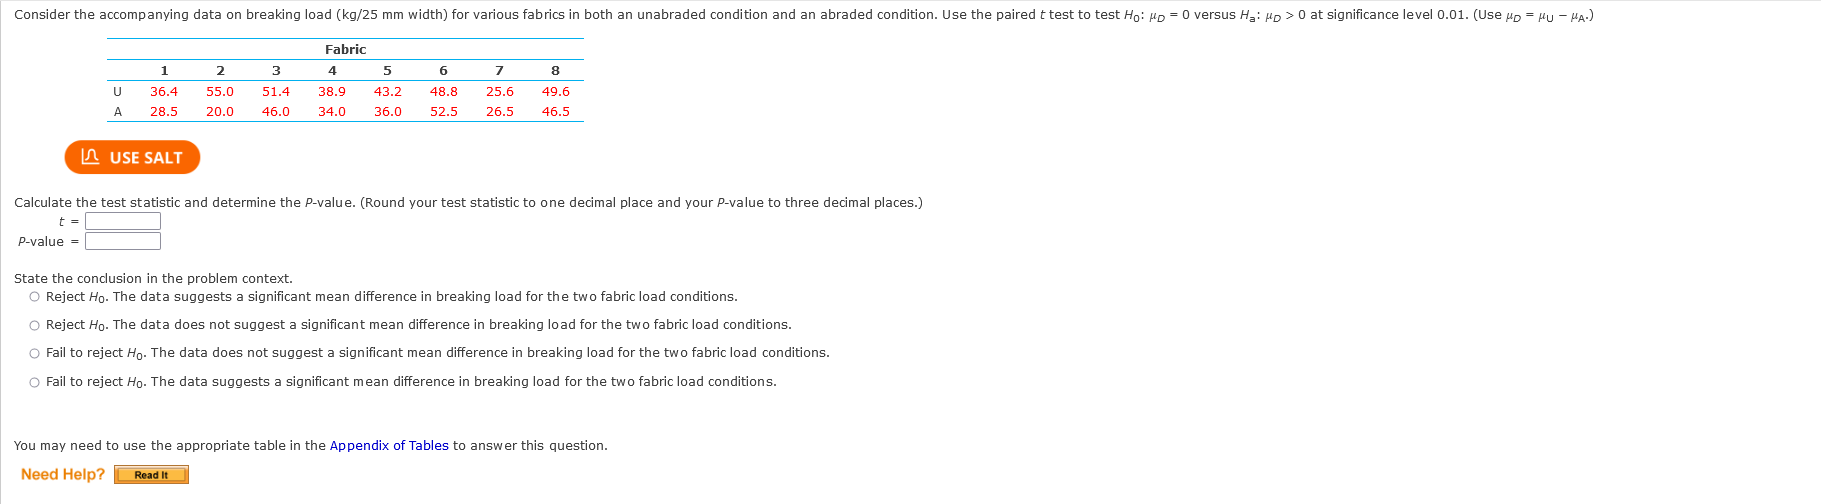

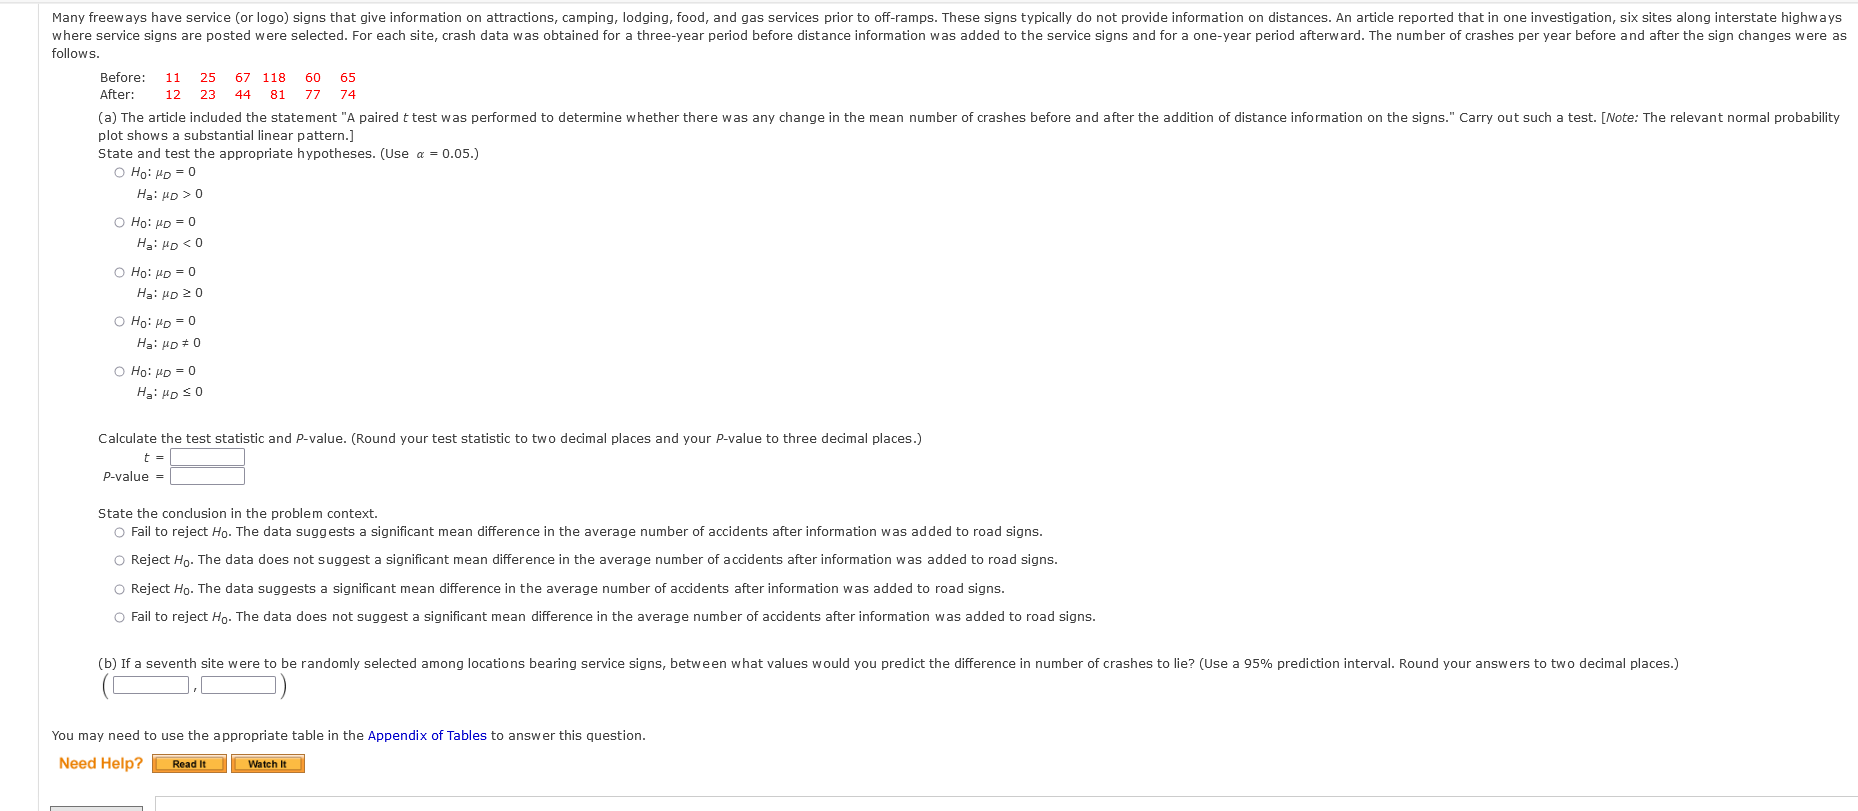
An article includes the accompanying data on compression strength (Ib) for a sample of 12-oz aluminum cans filled with strawberry drink and another sample filled with cola. Sample Sample Sample Beverage Size Mean SD Straw berry Drink 15 539 23 Cola 15 559 17 Does the data suggest that the extra carbonation of cola results in a higher average compression strength? Base your answer on a P-value. (Use a = 0.05.) LA USE SALT State the relevant hypotheses. (Use uj for the strawberry drink and #2 for the cola.) O Ho: H1 - 12 = 0 Hai H1 - 12 > 0 O Ho: H1 - #2 = 0 Hail1 - M2 2 0 O Ho: #1 - 12 = 0 Ha: H1 - 12 # 0 O Ho: H1 - #2 = 0 Ha: H1 - 12 0 at significance level 0.01. (Use up = HU - HA.) Fabric 1 2 3 4 5 6 7 8 36.4 55.0 51.4 38.9 43.2 48.8 25.6 49.6 A 28.5 20.0 46.0 34.0 36.0 52.5 26.5 46.5 LA USE SALT Calculate the test statistic and determine the P-value. (Round your test statistic to one decimal place and your P-value to three decimal places.) t = P-value = State the conclusion in the problem context. O Reject Ho. The data suggests a significant mean difference in breaking load for the two fabric load conditions. O Reject Ho. The data does not suggest a significant mean difference in breaking load for the two fabric load conditions. O Fail to reject Ho. The data does not suggest a significant mean difference in breaking load for the two fabric load conditions. O Fail to reject Ho. The data suggests a significant mean difference in breaking load for the two fabric load conditions. You may need to use the appropriate table in the Appendix of Tables to answer this question. Need Help? Read ItDo teachers find their work rewarding and satisfying? An article reports the results of a survey of 398 elementary school teachers and 266 high school teachers. Of the elementary school teachers, 227 said they were very satisfied with their jobs, whereas 128 of the high school teachers were very satisfied with their work. Estimate the difference between the proportion of all elementary school teachers who are satisfied and all high school teachers who are satisfied by calculating a 95% CI. (Use Pelementary - Phigh school. Round your answers to four decimal places.) USE SALT Interpret your 95% confidence interval. O We are 95% confident that the difference between the proportions of elementary school teachers who are satisfied and high school teachers who are satisfied falls below the lower bound. O We are 95% confident that the difference between the proportions of elementary school teachers who are satisfied and high school teachers who are satisfied falls outside these values. O We are 95% confident that the difference between the proportions of elementary school teachers who are satisfied and high school teachers who are satisfied falls between these values. We are 95% confident that the difference between the proportions of elementary school teachers who are satisfied and high school teachers who are satisfied falls above the upper bound. You may need to use the appropriate table in the Appendix of Tables to answer this question. Need Help? Read ItMany freeways have service (or logo) signs that give information on attractions, camping, lodging, food, and gas services prior to off-ramps. These signs typically do not provide information on distances. An article reported that in one investigation, six sites along interstate highways where service signs are posted were selected. For each site, crash data was obtained for a three-year period before distance information was added to the service signs and for a one-year period afterward. The number of crashes per year before and after the sign changes were as follows. Before: 11 25 67 118 60 After: 12 23 81 77 74 (a) The article included the statement "A paired t test was performed to determine whether there was any change in the mean number of crashes before and after the addition of distance information on the signs." Carry out such a test. [Note: The relevant normal probability plot shows a substantial linear pattern.] State and test the appropriate hypotheses. (Use a = 0.05.) O Ho: HD = 0 Hai HD > 0 Ho: HD = 0 Hai HD
Step by Step Solution
There are 3 Steps involved in it

Get step-by-step solutions from verified subject matter experts