

Question: 9. Open the file emission.xls. a) b) Prepare a scatter plot of CO emissions vs. hydrocarbon emissions and find the correlation coefficient. How strong is
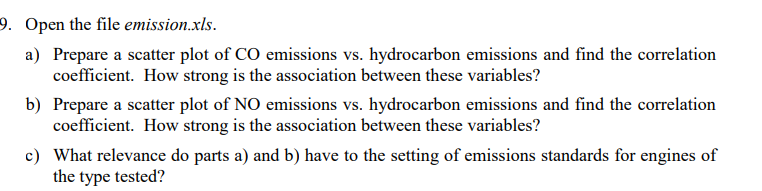
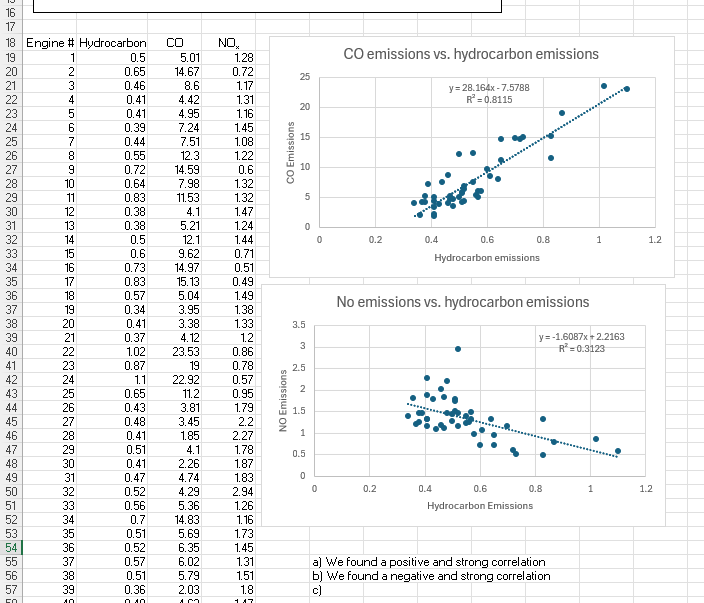
9. Open the file emission.xls. a) b) Prepare a scatter plot of CO emissions vs. hydrocarbon emissions and find the correlation coefficient. How strong is the association between these variables? Prepare a scatter plot of NO emissions vs. hydrocarbon emissions and find the correlation coefficient. How strong is the association between these variables? What relevance do parts a) and b) have to the setting of emissions standards for engines of the type tested? 18 Engine # Hydrocarbon CO NO. 0.5 5.01 1.28 CO emissions vs. hydrocarbon emissions 0.65 14.67 0.72 25 0.46 8.6 1. 17 y=28.164x - 7.5788 0.41 4.42 1.31 R = 0.8115 20 0.41 4.95 1. 16 0.39 7.24 1.45 0.44 7.51 1.08 15 0.55 12.3 1.22 CO Emissions 0.72 14.59 0.6 10 0.64 7.98 1.32 0.83 11.53 1.32 5 12 0.38 4.1 1.47 13 0.38 5.21 1.24 14 0.5 12.1 1.44 0.2 0.4 0.6 0.8 1 1.2 75 0.6 9.62 0.7 Hydrocarbon emissions 16 0.73 14.97 0.5 17 0.83 15.13 0.49 18 0.57 5.04 1.49 19 0.34 3.95 1.38 No emissions vs. hydrocarbon emissions 20 0.41 3.38 1.33 3.5 39 21 0.37 4. 12 1.2 y=-1.6087x - 2.2163 1.02 2 40 22 23.53 0.86 R= 0.3123 23 0.87 19 0.78 2.5 42 24 1.1 22.92 0.57 43 25 0.65 11.2 0.95 2 NO Emissions 44 26 0.43 3.81 1.79 1. 27 0.48 3.45 2.2 28 0.41 1.85 2.27 1 47 29 0.51 4.1 1.7 0.5 48 30 0.41 2.26 1.87 49 31 0.47 4.74 1.83 50 32 0.52 4.29 2.94 0.2 0.4 0.6 0.8 1 1.2 33 0.56 5.36 1.26 Hydrocarbon Emissions 52 34 0.7 14.83 1. 16 53 35 0.51 5.69 1.73 54 36 0.52 6.35 1.45 55 37 0.57 6.02 1.31 =] We found a positive and strong correlation 56 38 0.51 5.79 1.51 bi We found a negative and strong correlation 57 39 0.36 2.03 1.8 c)
Step by Step Solution
There are 3 Steps involved in it

Get step-by-step solutions from verified subject matter experts