

Question: 9. Refer to Table 1, which gives summary statistics for the monthly returns (expressed as a percent) of the S&P 500, APPLE and Facebook (FB)
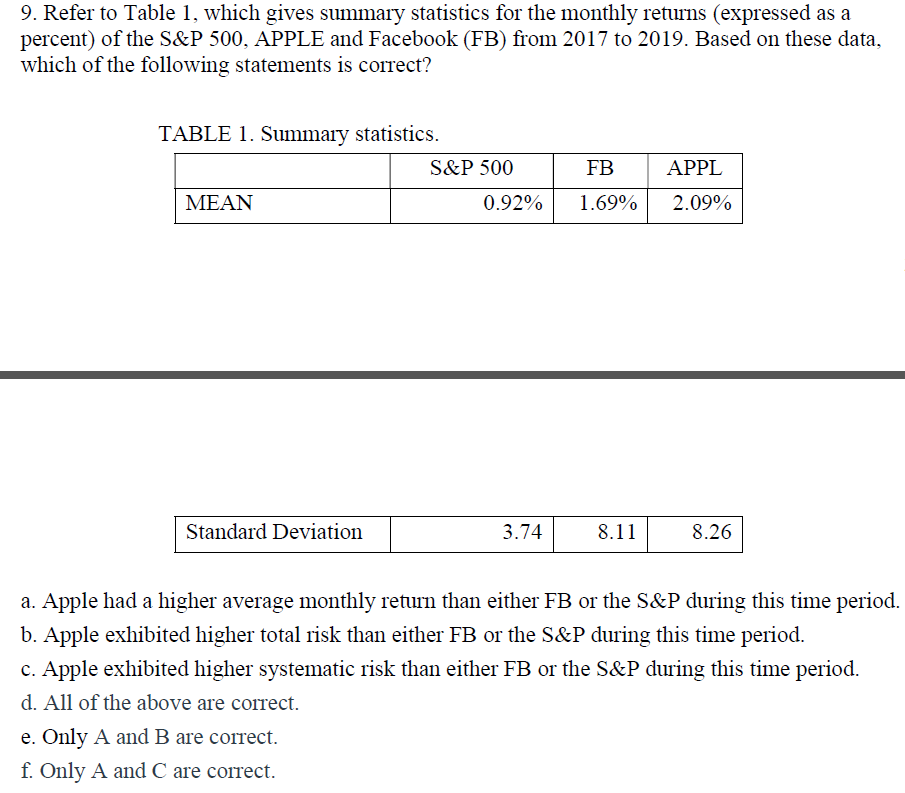
9. Refer to Table 1, which gives summary statistics for the monthly returns (expressed as a percent) of the S&P 500, APPLE and Facebook (FB) from 2017 to 2019. Based on these data, which of the following statements is correct? TABLE 1. Summary statistics. S&P 500 FB APPL MEAN 0.92% 1.69% 2.09% Standard Deviation 3.74 8.11 8.26 a. Apple had a higher average monthly return than either FB or the S&P during this time period. b. Apple exhibited higher total risk than either FB or the S&P during this time period. c. Apple exhibited higher systematic risk than either FB or the S&P during this time period. d. All of the above are correct. e. Only A and B are correct. f. Only A and C are correct
Step by Step Solution
There are 3 Steps involved in it

Get step-by-step solutions from verified subject matter experts