

Question: 9. The following data was collected using a 2 x 2 between-subjects research design. (a) Summarize the values, (b) graph the results, and indicate the

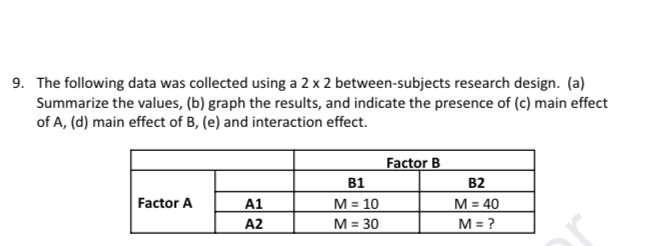
9. The following data was collected using a 2 x 2 between-subjects research design. (a) Summarize the values, (b) graph the results, and indicate the presence of (c) main effect of A, (d) main effect of B, (e) and interaction effect. Factor B B1 B2 Factor A A1 M = 10 M = 40 A2 M = 30 M =
Step by Step Solution
There are 3 Steps involved in it
1 Expert Approved Answer
Step: 1 Unlock

Question Has Been Solved by an Expert!
Get step-by-step solutions from verified subject matter experts
Step: 2 Unlock
Step: 3 Unlock