

Question: 9. The standard normal curve shown 10 below is a probability density curve for a continuous random variable. What is the area of the shaded
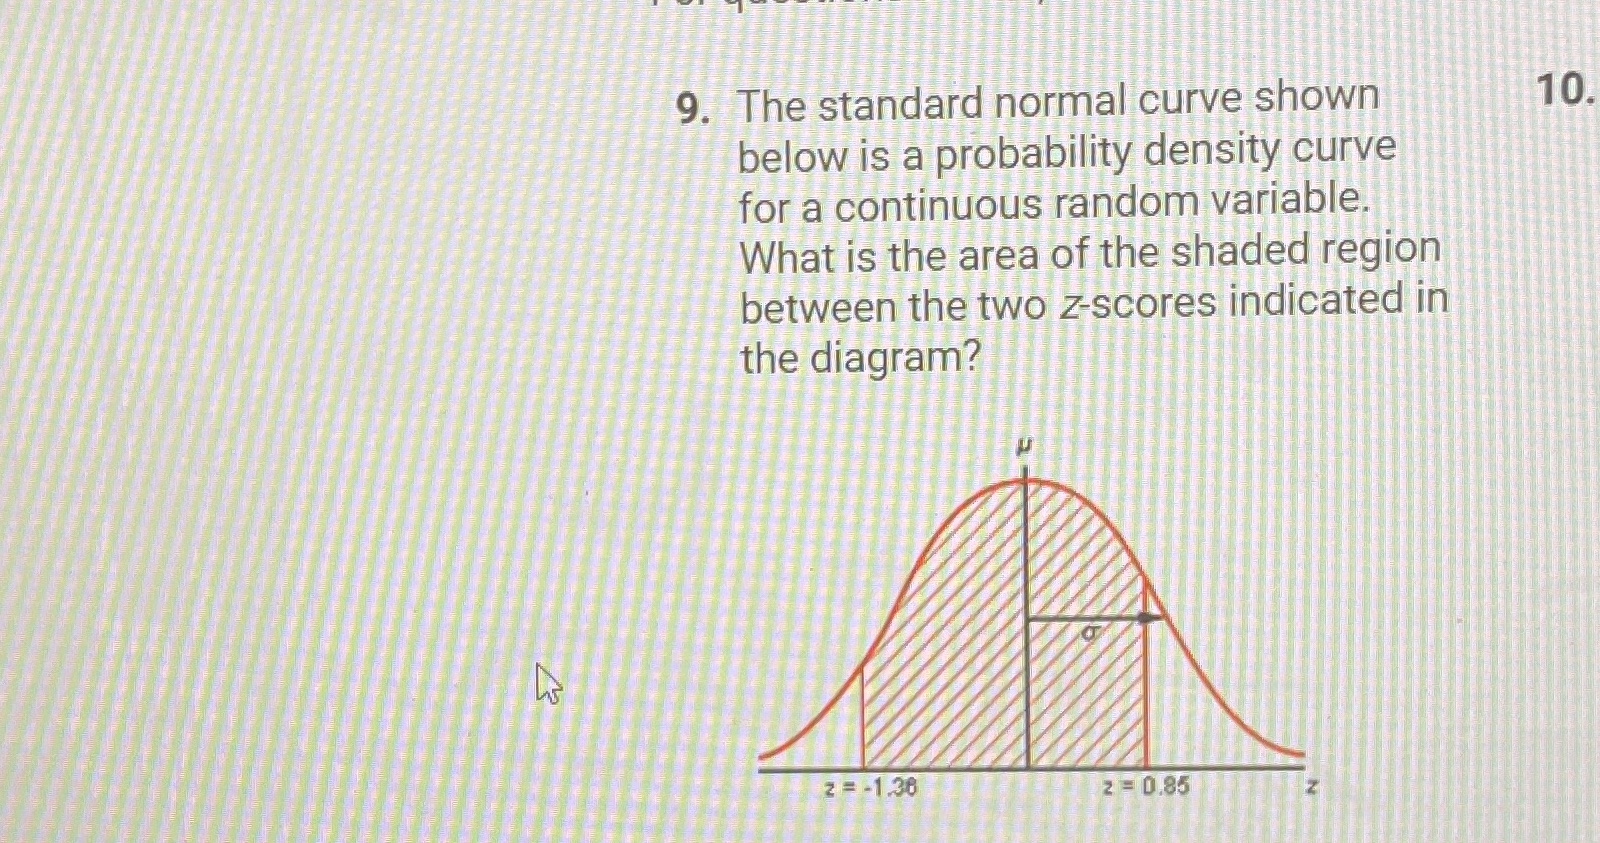
9. The standard normal curve shown 10 below is a probability density curve for a continuous random variable. What is the area of the shaded region between the two z-scores indicated in the diagram? Z =-1.36 2 = 0.85
Step by Step Solution
There are 3 Steps involved in it
1 Expert Approved Answer
Step: 1 Unlock

Question Has Been Solved by an Expert!
Get step-by-step solutions from verified subject matter experts
Step: 2 Unlock
Step: 3 Unlock