

Question: 9. Using the data in the file RainbowCamping, a single chart that displays both the outbound and inbound shipping costs for each month on the
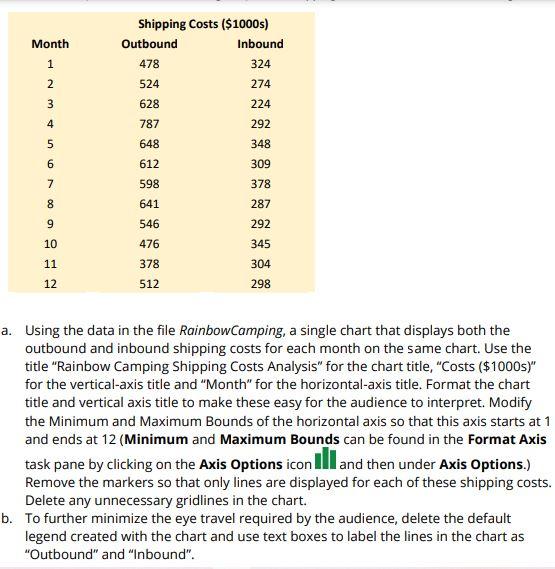
9. Using the data in the file RainbowCamping, a single chart that displays both the outbound and inbound shipping costs for each month on the same chart. Use the title "Rainbow Camping Shipping Costs Analysis" for the chart title, "Costs (\$1000s)" for the vertical-axis title and "Month" for the horizontal-axis title. Format the chart title and vertical axis title to make these easy for the audience to interpret. Modify the Minimum and Maximum Bounds of the horizontal axis so that this axis starts at 1 and ends at 12 (Minimum and Maximum Bounds can be found in the Format Axis task pane by clicking on the Axis Options icon M and then under Axis Options.) Remove the markers so that only lines are displayed for each of these shipping costs. Delete any unnecessary gridlines in the chart. b. To further minimize the eye travel required by the audience, delete the default legend created with the chart and use text boxes to label the lines in the chart as "Outbound" and "Inbound". 9. Using the data in the file RainbowCamping, a single chart that displays both the outbound and inbound shipping costs for each month on the same chart. Use the title "Rainbow Camping Shipping Costs Analysis" for the chart title, "Costs (\$1000s)" for the vertical-axis title and "Month" for the horizontal-axis title. Format the chart title and vertical axis title to make these easy for the audience to interpret. Modify the Minimum and Maximum Bounds of the horizontal axis so that this axis starts at 1 and ends at 12 (Minimum and Maximum Bounds can be found in the Format Axis task pane by clicking on the Axis Options icon M and then under Axis Options.) Remove the markers so that only lines are displayed for each of these shipping costs. Delete any unnecessary gridlines in the chart. b. To further minimize the eye travel required by the audience, delete the default legend created with the chart and use text boxes to label the lines in the chart as "Outbound" and "Inbound
Step by Step Solution
There are 3 Steps involved in it

Get step-by-step solutions from verified subject matter experts