

Question: 9. What does an analysis of the data in case Exhibit 1 reveal about Chipotle Mexican Grill's financial and operating performance? Use the financial ratios
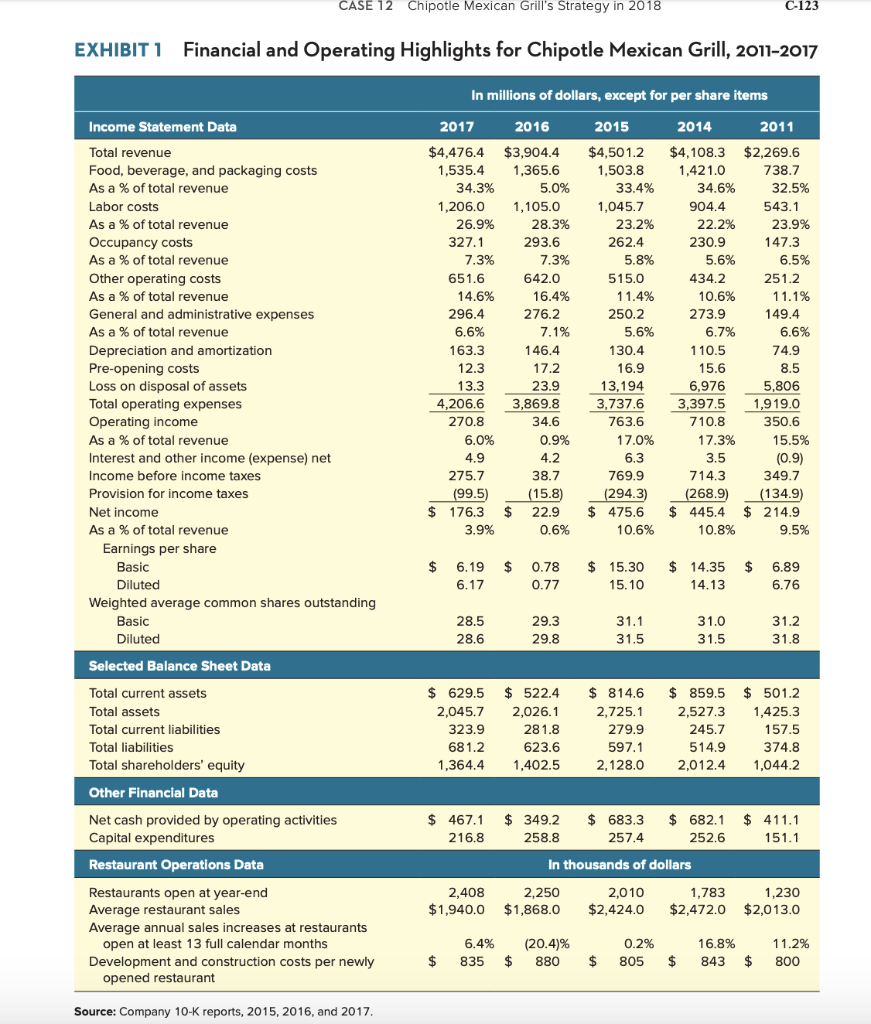
9. What does an analysis of the data in case Exhibit 1 reveal about Chipotle Mexican Grill's financial and operating performance? Use the financial ratios in Table 4.1 of Chapter 4 as a guide in doing the calculations needed to arrive at an analysis-based answer to your assessment of Chipotle's financial performance. In addition to the ratios in Table 4.1, there are occasions when you will also need to calculate compound average growth rates (CAGR) for certain financial measures. The formula for calculating CAGR (in percentage terms) is as follows: CAGR % = [ending value - beginning value) 1-1 x 100 (where n = the number of year-to-year or period-to-period changes) CASE 12 Chipotle Mexican Grill's Strategy in 2018 C-123 EXHIBIT 1 Financial and Operating Highlights for Chipotle Mexican Grill, 2011-2017 In millions of dollars, except for per share items Income Statement Data 2017 $4,476.4 1,535.4 34.3% 1,206. 0 26.9% 327.1 7.3% 651.6 14.6% 296.4 6.6% 163.3 12.3 13.3 4,206.6 270.8 6.0% 2016 $3,904.4 1,365.6 5.0% 1 ,105.0 28.3% 293.6 7.3% 642.0 16.4% 276.2 7.1% 146.4 Total revenue Food, beverage, and packaging costs As a % of total revenue Labor costs As a % of total revenue Occupancy costs As a % of total revenue Other operating costs As a % of total revenue General and administrative expenses As a % of total revenue Depreciation and amortization Pre-opening costs Loss on disposal of assets Total operating expenses Operating income As a % of total revenue Interest and other income (expense) net Income before income taxes Provision for income taxes Net income As a % of total revenue Earnings per share Basic Diluted Weighted average common shares outstanding Basic Diluted 2015 $4,50 1.2 1,503.8 33.4% 1,045.7 23.2% 262.4 5.8% 515.0 11.4% 250.2 5.6% 130.4 16.9 13,194 3,737.6 763.6 17.0% 6.3 769.9 (294.3) $ 475.6 2014 $4,108.3 1,421.0 34.6% 904.4 22.2% 230.9 5.6% 434.2 10.6% 273.9 6.7% 110.5 15.6 6,976 3,397.5 710.8 17.3% 3.5 714.3 (268.9) $ 445.4 2011 $2,269.6 738.7 32.5% 543.1 23.9% 147.3 6.5% 251.2 11.1% 149.4 6.6% 74.9 8.5 5,806 1,919.0 350.6 15.5% (0.9) 349.7 (134.9) $ 214.9 17.2 4.9 23.9 3,869.8 34.6 0.9% 4.2 38.7 (15.8) $ 22.9 0.6% 275.7 (99.5) 176.3 3.9% $ $ $ $ $ $ 6.19 6.17 0.78 0.77 15.30 15.10 14.35 14.13 6.89 6.76 28.5 28.6 29. 3 29.8 31. 1 31.5 31.0 31.5 31.2 31.8 Selected Balance Sheet Data Total current assets Total assets Total current liabilities Total liabilities Total shareholders' equity $ 629.5 2,045.7 323. 9 681. 2 1,364.4 $ 522.4 2,026.1 281.8 623. 6 1,402.5 $ 814.6 2,725.1 279.9 597.1 2,128. 0 $ 859.5 2,527.3 245.7 514.9 2 .012.4 $ 501.2 1,425.3 157.5 374.8 1,044.2 Other Financial Data Net cash provided by operating activities Capital expenditures Restaurant Operations Data $ 467.1 216.8 $ 411.1 151.1 $ 349.2 $ 683.3 $ 682.1 258.8 257.4 252.6 In thousands of dollars 2,250 2,010 1,783 $1,868.0 $2,424.0 $2,472.0 2,408 $1,940.0 1,230 $2,013.0 Restaurants open at year-end Average restaurant sales Average annual sales increases at restaurants open at least 13 full calendar months Development and construction costs per newly opened restaurant $ 6.4% 835 $ (20.4)% 880 $ 0.2% 805 $ 16.8% 843 $ 11.2% 800 Source: Company 10-K reports, 2015, 2016, and 2017. 9. What does an analysis of the data in case Exhibit 1 reveal about Chipotle Mexican Grill's financial and operating performance? Use the financial ratios in Table 4.1 of Chapter 4 as a guide in doing the calculations needed to arrive at an analysis-based answer to your assessment of Chipotle's financial performance. In addition to the ratios in Table 4.1, there are occasions when you will also need to calculate compound average growth rates (CAGR) for certain financial measures. The formula for calculating CAGR (in percentage terms) is as follows: CAGR % = [ending value - beginning value) 1-1 x 100 (where n = the number of year-to-year or period-to-period changes) CASE 12 Chipotle Mexican Grill's Strategy in 2018 C-123 EXHIBIT 1 Financial and Operating Highlights for Chipotle Mexican Grill, 2011-2017 In millions of dollars, except for per share items Income Statement Data 2017 $4,476.4 1,535.4 34.3% 1,206. 0 26.9% 327.1 7.3% 651.6 14.6% 296.4 6.6% 163.3 12.3 13.3 4,206.6 270.8 6.0% 2016 $3,904.4 1,365.6 5.0% 1 ,105.0 28.3% 293.6 7.3% 642.0 16.4% 276.2 7.1% 146.4 Total revenue Food, beverage, and packaging costs As a % of total revenue Labor costs As a % of total revenue Occupancy costs As a % of total revenue Other operating costs As a % of total revenue General and administrative expenses As a % of total revenue Depreciation and amortization Pre-opening costs Loss on disposal of assets Total operating expenses Operating income As a % of total revenue Interest and other income (expense) net Income before income taxes Provision for income taxes Net income As a % of total revenue Earnings per share Basic Diluted Weighted average common shares outstanding Basic Diluted 2015 $4,50 1.2 1,503.8 33.4% 1,045.7 23.2% 262.4 5.8% 515.0 11.4% 250.2 5.6% 130.4 16.9 13,194 3,737.6 763.6 17.0% 6.3 769.9 (294.3) $ 475.6 2014 $4,108.3 1,421.0 34.6% 904.4 22.2% 230.9 5.6% 434.2 10.6% 273.9 6.7% 110.5 15.6 6,976 3,397.5 710.8 17.3% 3.5 714.3 (268.9) $ 445.4 2011 $2,269.6 738.7 32.5% 543.1 23.9% 147.3 6.5% 251.2 11.1% 149.4 6.6% 74.9 8.5 5,806 1,919.0 350.6 15.5% (0.9) 349.7 (134.9) $ 214.9 17.2 4.9 23.9 3,869.8 34.6 0.9% 4.2 38.7 (15.8) $ 22.9 0.6% 275.7 (99.5) 176.3 3.9% $ $ $ $ $ $ 6.19 6.17 0.78 0.77 15.30 15.10 14.35 14.13 6.89 6.76 28.5 28.6 29. 3 29.8 31. 1 31.5 31.0 31.5 31.2 31.8 Selected Balance Sheet Data Total current assets Total assets Total current liabilities Total liabilities Total shareholders' equity $ 629.5 2,045.7 323. 9 681. 2 1,364.4 $ 522.4 2,026.1 281.8 623. 6 1,402.5 $ 814.6 2,725.1 279.9 597.1 2,128. 0 $ 859.5 2,527.3 245.7 514.9 2 .012.4 $ 501.2 1,425.3 157.5 374.8 1,044.2 Other Financial Data Net cash provided by operating activities Capital expenditures Restaurant Operations Data $ 467.1 216.8 $ 411.1 151.1 $ 349.2 $ 683.3 $ 682.1 258.8 257.4 252.6 In thousands of dollars 2,250 2,010 1,783 $1,868.0 $2,424.0 $2,472.0 2,408 $1,940.0 1,230 $2,013.0 Restaurants open at year-end Average restaurant sales Average annual sales increases at restaurants open at least 13 full calendar months Development and construction costs per newly opened restaurant $ 6.4% 835 $ (20.4)% 880 $ 0.2% 805 $ 16.8% 843 $ 11.2% 800 Source: Company 10-K reports, 2015, 2016, and 2017
Step by Step Solution
There are 3 Steps involved in it

Get step-by-step solutions from verified subject matter experts