

What does an analysis of the data in case Exhibit 1 reveal about Chipotle Mexican Grill's...
Fantastic news! We've Found the answer you've been seeking!
Question:
Transcribed Image Text:
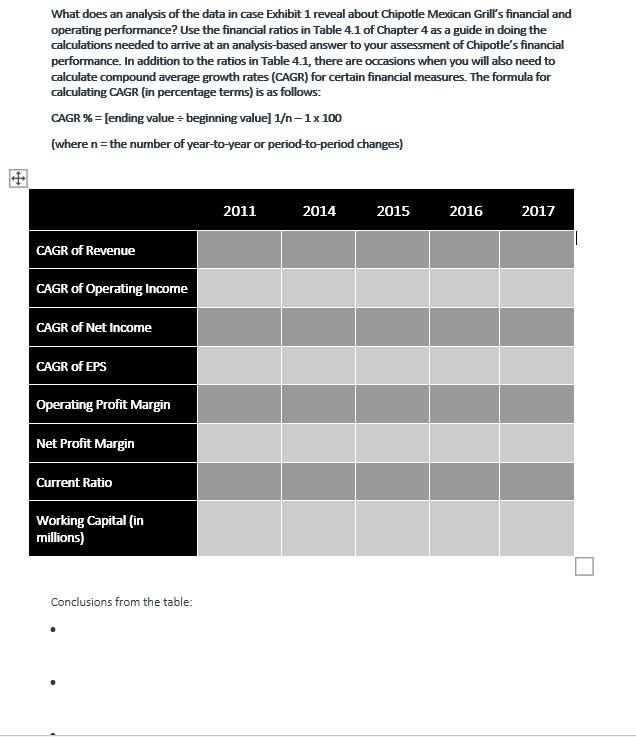
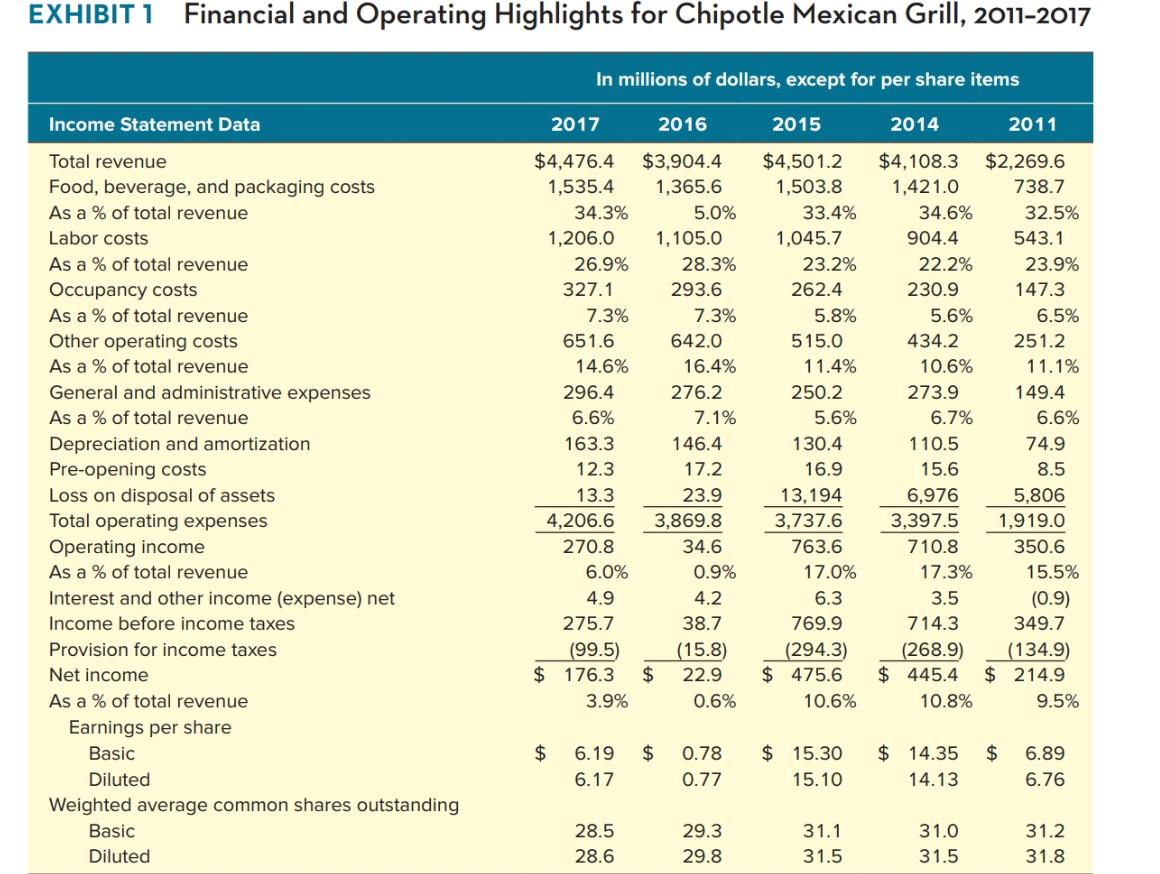
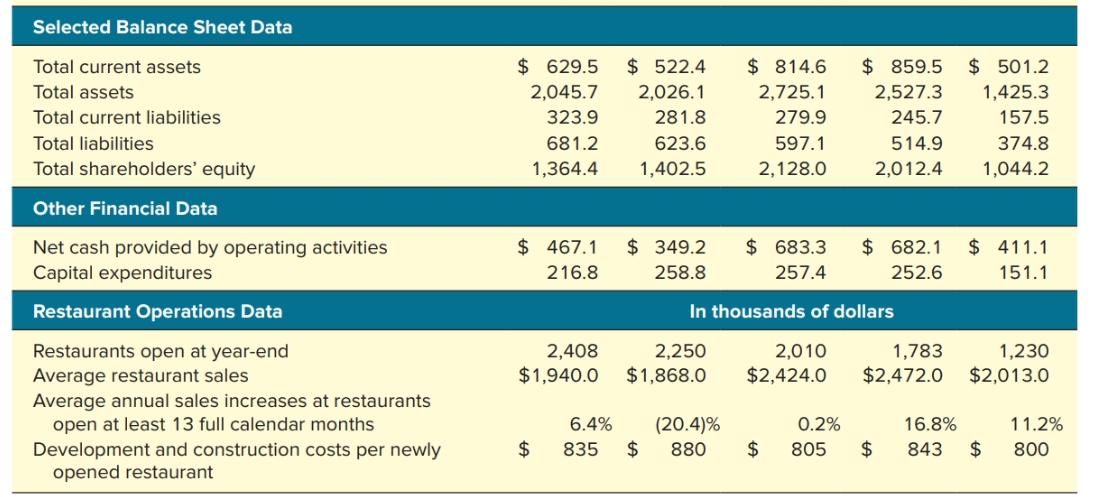
What does an analysis of the data in case Exhibit 1 reveal about Chipotle Mexican Grill's financial and operating performance? Use the financial ratios in Table 4.1 of Chapter 4 as a guide in doing the calculations needed to arrive at an analysis-based answer to your assessment of Chipotle's financial performance. In addition to the ratios in Table 4.1, there are occasions when you will also need to calculate compound average growth rates (CAGR) for certain financial measures. The formula for calculating CAGR (in percentage terms) is as follows: CAGR % = [ending value = beginning value] 1/n-1x 100 (where n= the number of year-to-year or period-to-period changes) 2011 2014 2015 2016 2017 CAGR of Revenue CAGR of Operating Income CAGR of Net Income CAGR of EPS Operating Profit Margin Net Profit Margin Current Ratio Working Capital (in millions) Conclusions from the table: EXHIBIT 1 Financial and Operating Highlights for Chipotle Mexican Grill, 2011-2017 In millions of dollars, except for per share items Income Statement Data 2017 2016 2015 2014 2011 Total revenue $4,476.4 $3,904.4 $4,501.2 $4,108.3 $2,269.6 738.7 Food, beverage, and packaging costs As a % of total revenue 1,535.4 1,365.6 1,503.8 1,421.0 34.3% 5.0% 33.4% 34.6% 32.5% Labor costs 1,206.0 1,105.0 1,045.7 904.4 543.1 As a % of total revenue Occupancy costs As a % of total revenue 26.9% 28.3% 23.2% 22.2% 23.9% 327.1 293.6 262.4 230.9 147.3 7.3% 7.3% 5.8% 5.6% 6.5% Other operating costs As a % of total revenue 651.6 642.0 515.0 434.2 251.2 14.6% 16.4% 11.4% 10.6% 11.1% General and administrative expenses 296.4 276.2 250.2 273.9 149.4 As a % of total revenue 6.6% 7.1% 5.6% 6.7% 6.6% Depreciation and amortization 163.3 146.4 130.4 110.5 74.9 Pre-opening costs Loss on disposal of assets Total operating expenses Operating income As a % of total revenue 12.3 17.2 16.9 15.6 8.5 13.3 23.9 13,194 6,976 5,806 4,206.6 3,869.8 3,737.6 3,397.5 1,919.0 270.8 34.6 763.6 710.8 350.6 6.0% 0.9% 17.0% 17.3% 15.5% Interest and other income (expense) net Income before income taxes 4.9 4.2 6.3 3.5 (0.9) 275.7 38.7 769.9 714.3 349.7 (15.8) 2$ Provision for income taxes (99.5) (294.3) $ 475.6 (268.9) $ 445.4 (134.9) Net income $ 176.3 22.9 $ 214.9 As a % of total revenue 3.9% 0.6% 10.6% 10.8% 9.5% Earnings per share Basic $ 6.19 $ 0.78 $ 15.30 $ 14.35 $ 6.89 Diluted 6.17 0.77 15.10 14.13 6.76 Weighted average common shares outstanding Basic 28.5 29.3 31.1 31.0 31.2 Diluted 28.6 29.8 31.5 31.5 31.8 Selected Balance Sheet Data Total current assets $ 629.5 $ 522.4 $ 814.6 $ 859.5 $ 501.2 Total assets 2,045.7 2,026.1 2,725.1 2,527.3 1,425.3 Total current liabilities 323.9 281.8 279.9 245.7 157.5 Total liabilities 681.2 623.6 597.1 514.9 374.8 Total shareholders' equity 1,364.4 1,402.5 2,128.0 2,012.4 1,044.2 Other Financial Data $ 467.1 $ 349.2 $ 683.3 $ 682.1 $ 411.1 Net cash provided by operating activities Capital expenditures 216.8 258.8 257.4 252.6 151.1 Restaurant Operations Data In thousands of dollars Restaurants open at year-end Average restaurant sales Average annual sales increases at restaurants open at least 13 full calendar months 2,250 $1,868.0 1,230 $2,013.0 2,010 2,408 $1,940.0 1,783 $2,472.0 $2,424.0 (20.4)% 2$ 6.4% 0.2% 16.8% 11.2% 24 $ 24 $ Development and construction costs per newly opened restaurant 835 880 805 843 800 What does an analysis of the data in case Exhibit 1 reveal about Chipotle Mexican Grill's financial and operating performance? Use the financial ratios in Table 4.1 of Chapter 4 as a guide in doing the calculations needed to arrive at an analysis-based answer to your assessment of Chipotle's financial performance. In addition to the ratios in Table 4.1, there are occasions when you will also need to calculate compound average growth rates (CAGR) for certain financial measures. The formula for calculating CAGR (in percentage terms) is as follows: CAGR % = [ending value = beginning value] 1/n-1x 100 (where n= the number of year-to-year or period-to-period changes) 2011 2014 2015 2016 2017 CAGR of Revenue CAGR of Operating Income CAGR of Net Income CAGR of EPS Operating Profit Margin Net Profit Margin Current Ratio Working Capital (in millions) Conclusions from the table: EXHIBIT 1 Financial and Operating Highlights for Chipotle Mexican Grill, 2011-2017 In millions of dollars, except for per share items Income Statement Data 2017 2016 2015 2014 2011 Total revenue $4,476.4 $3,904.4 $4,501.2 $4,108.3 $2,269.6 738.7 Food, beverage, and packaging costs As a % of total revenue 1,535.4 1,365.6 1,503.8 1,421.0 34.3% 5.0% 33.4% 34.6% 32.5% Labor costs 1,206.0 1,105.0 1,045.7 904.4 543.1 As a % of total revenue Occupancy costs As a % of total revenue 26.9% 28.3% 23.2% 22.2% 23.9% 327.1 293.6 262.4 230.9 147.3 7.3% 7.3% 5.8% 5.6% 6.5% Other operating costs As a % of total revenue 651.6 642.0 515.0 434.2 251.2 14.6% 16.4% 11.4% 10.6% 11.1% General and administrative expenses 296.4 276.2 250.2 273.9 149.4 As a % of total revenue 6.6% 7.1% 5.6% 6.7% 6.6% Depreciation and amortization 163.3 146.4 130.4 110.5 74.9 Pre-opening costs Loss on disposal of assets Total operating expenses Operating income As a % of total revenue 12.3 17.2 16.9 15.6 8.5 13.3 23.9 13,194 6,976 5,806 4,206.6 3,869.8 3,737.6 3,397.5 1,919.0 270.8 34.6 763.6 710.8 350.6 6.0% 0.9% 17.0% 17.3% 15.5% Interest and other income (expense) net Income before income taxes 4.9 4.2 6.3 3.5 (0.9) 275.7 38.7 769.9 714.3 349.7 (15.8) 2$ Provision for income taxes (99.5) (294.3) $ 475.6 (268.9) $ 445.4 (134.9) Net income $ 176.3 22.9 $ 214.9 As a % of total revenue 3.9% 0.6% 10.6% 10.8% 9.5% Earnings per share Basic $ 6.19 $ 0.78 $ 15.30 $ 14.35 $ 6.89 Diluted 6.17 0.77 15.10 14.13 6.76 Weighted average common shares outstanding Basic 28.5 29.3 31.1 31.0 31.2 Diluted 28.6 29.8 31.5 31.5 31.8 Selected Balance Sheet Data Total current assets $ 629.5 $ 522.4 $ 814.6 $ 859.5 $ 501.2 Total assets 2,045.7 2,026.1 2,725.1 2,527.3 1,425.3 Total current liabilities 323.9 281.8 279.9 245.7 157.5 Total liabilities 681.2 623.6 597.1 514.9 374.8 Total shareholders' equity 1,364.4 1,402.5 2,128.0 2,012.4 1,044.2 Other Financial Data $ 467.1 $ 349.2 $ 683.3 $ 682.1 $ 411.1 Net cash provided by operating activities Capital expenditures 216.8 258.8 257.4 252.6 151.1 Restaurant Operations Data In thousands of dollars Restaurants open at year-end Average restaurant sales Average annual sales increases at restaurants open at least 13 full calendar months 2,250 $1,868.0 1,230 $2,013.0 2,010 2,408 $1,940.0 1,783 $2,472.0 $2,424.0 (20.4)% 2$ 6.4% 0.2% 16.8% 11.2% 24 $ 24 $ Development and construction costs per newly opened restaurant 835 880 805 843 800
Expert Answer:
Answer rating: 100% (QA)
Analysis of the table shows that the financial performance of the Chipotle Mexican Grill indicates s... View the full answer

Related Book For 
Financial accounting
ISBN: 978-1118285909
IFRS Edition
Authors: Jerry J. Weygandt, Donald E. Kieso, Paul D. Kimmel
Posted Date:
Students also viewed these management leadership questions
-
What does the data in case Exhibit 1 reveal about lululemon's financial and operating performance?
-
For the regression analysis of the data in Exercise 15.77: a. Use the 0.10 level in testing whether the population coefficient of correlation could be zero. b. Use the 0.10 level in testing whether...
-
For the regression analysis of the data in Exercise 15.79: a. Use the 0.05 level in testing whether the population coefficient of correlation could be zero. b. Use the 0.05 level in testing whether...
-
Freddie and Jason have just opened the Texas Toothpick, a chain-saw sharpening and repair service located on Elm Street. The Texas Toothpick promises same-week repair service. Freddie and Jason are...
-
Consider again the conditions of Exercise 9. Let X denote a random variable for which the c.d.f. is F(x), and let Y denote a random variable for which the c.d.f. is G(x). Use the Kolmogorov-Smirnov...
-
You are now ready to create the functional decomposition diagram for the case-tracking system. What is the root process for the function decomposition diagram? What subsystems would you typically...
-
How you may use computers for litigation support?
-
The 12 partners of a regional public accounting firm met in special session to discuss audit engagement efficiency. Jones spoke up, saying, We all certainly appreciate the firm wide policies set up...
-
2 7 The bank made an EFT payment of a telephone bill of $ 5 , 0 0 0 . How would this information be included on the bank reconciliation?
-
Today is May 15, 2000, and the current, semi-annually compounded yield curve is in Table 3.6. Compute the duration for the following securities: (a) 3-year zero coupon bond (b) 3 1/4-year coupon bond...
-
For each of the following, evaluate or solve, assuming that the function is one-to-one. a. If f(1) = -9, then f-(-9) = b. If f(-8)= 7, then f(7) = = c. If f(6) = 4, then f(4)=| d. If f(-5) = 9, then...
-
Solve the absolute value inequality. Write the solution in interval notation. 3x+4+36
-
1. Consider the following Java program, which consists of the class Spends. Notice this defines getSpend, is Amount and tostring methods. Remember that Integer.parseInt applied to a string...
-
During Heaton Company's first two years of operations, it reported absorption costing net operating Income as follows: Sales (@ $64 per unit) Cost of goods sold (@ $35 per unit) Gross margin Selling...
-
Draw out the truth tables for each of the equations Do D- 140 D10 Y= (A.B). (c.) De D DAD D BOD Y = (AB) (CD) (A.B) + (CD) (ADB) (CHD)
-
Solve using the principles together. Don't forget to check. 7x+8=44-6x+x
-
So, why is it important to be able to calculate the future value of some amount invested? JENNIFER: First, remember that the amount invested is usually called , and the amount earned during the...
-
Economic feasibility is an important guideline in designing cost accounting systems. Do you agree? Explain.
-
Information related to Izmir Company for 2011 is summarized below. Total credit sales ............. TL1,100,000 Accounts receivable at December 31 ..... 369,000 Bad debts written off .................
-
Recife Company has an inexperienced accountant. During the first 2 weeks on the job, the accountant made the following errors in journalizing transactions. All entries were posted as made. 1. A...
-
Bebeto Company purchases a patent for R$120,000 on January 2, 2011. Its estimated useful life is 10 years. (a) Prepare the journal entry to record patent expense for the first year. (b) Show how this...
-
The equations of motion of a two-degree-of-freedom system are given by \(2 \ddot{x}_{1}+6 x_{1}-2 x_{2}=5\) and \(\ddot{x}_{2}-2 x_{1}+4 x_{2}=20 \sin 5 t\). Assuming the initial conditions as...
-
The ends of a beam are elastically restrained by linear and torsional springs, as shown in Fig. 11.11. Using the finite difference method, express the boundary conditions. k W(x) k 00000 Deflected...
-
Find the natural frequencies of a fixed-fixed bar undergoing longitudinal vibration, using three mesh points in the range \(0

Study smarter with the SolutionInn App