

Question: 9. Write a function y = problem_9(x) to implement the following graph for a single value. Then create a vector of x-values from - 10
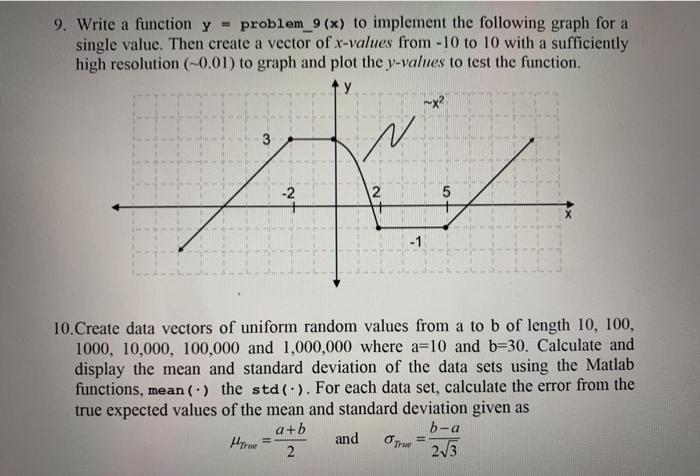
9. Write a function y = problem_9(x) to implement the following graph for a single value. Then create a vector of x-values from - 10 to 10 with a sufficiently high resolution (-0,01) to graph and plot the y-values to test the function. X2 -2 2 5 -1 10.Create data vectors of uniform random values from a to b of length 10, 100, 1000, 10,000, 100,000 and 1,000,000 where a=10 and b=30. Calculate and display the mean and standard deviation of the data sets using the Matlab functions, mean() the std (-). For each data set, calculate the error from the true expected values of the mean and standard deviation given as a+b and 2 23 b-a Here True
Step by Step Solution
There are 3 Steps involved in it
1 Expert Approved Answer
Step: 1 Unlock

Question Has Been Solved by an Expert!
Get step-by-step solutions from verified subject matter experts
Step: 2 Unlock
Step: 3 Unlock