

Question: 90908202109 Assessments Assignment 6 - Chapter 6 The graph below illustrates the average and marginal product of labour for Get Smart Enterprises. ut of Average
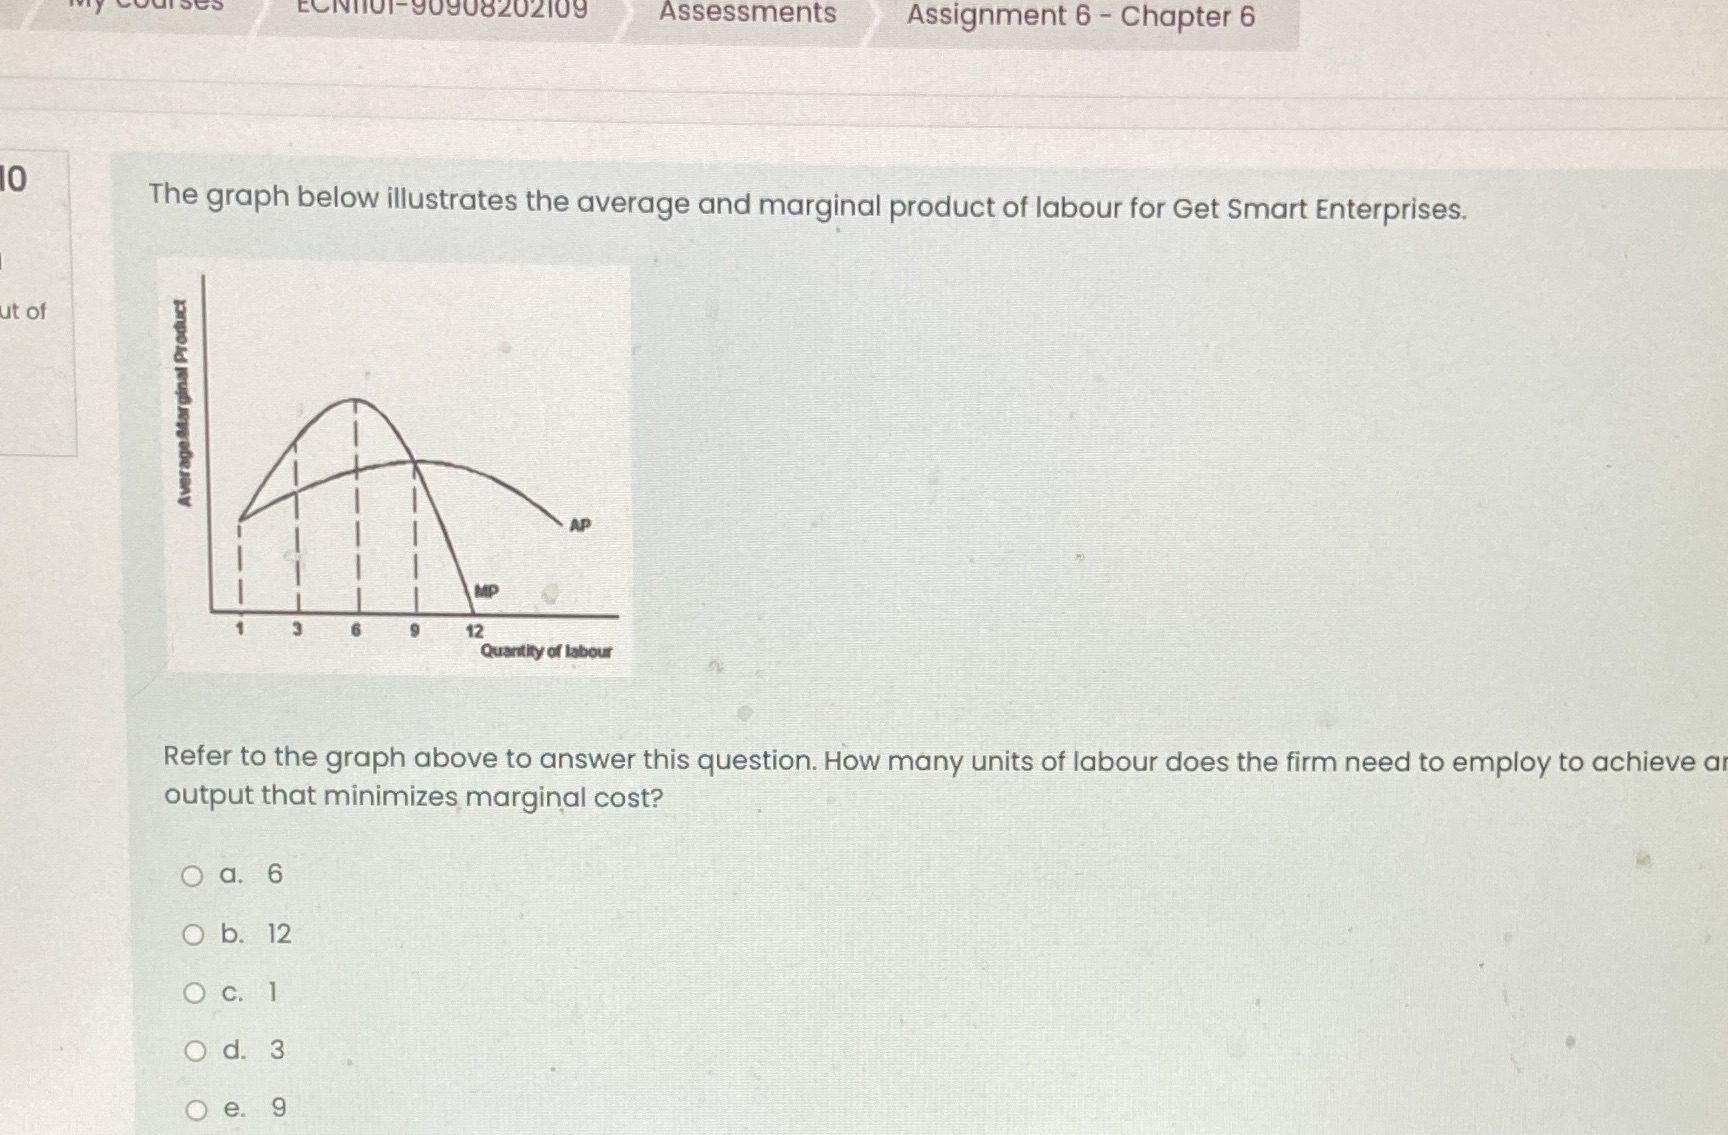
90908202109 Assessments Assignment 6 - Chapter 6 The graph below illustrates the average and marginal product of labour for Get Smart Enterprises. ut of Average Marginal Product Quantity of labour Refer to the graph above to answer this question. How many units of labour does the firm need to employ to achieve a output that minimizes marginal cost? O a. 6 O b. 12 O c. 1 O d. 3 O e. 9
Step by Step Solution
There are 3 Steps involved in it
1 Expert Approved Answer
Step: 1 Unlock

Question Has Been Solved by an Expert!
Get step-by-step solutions from verified subject matter experts
Step: 2 Unlock
Step: 3 Unlock