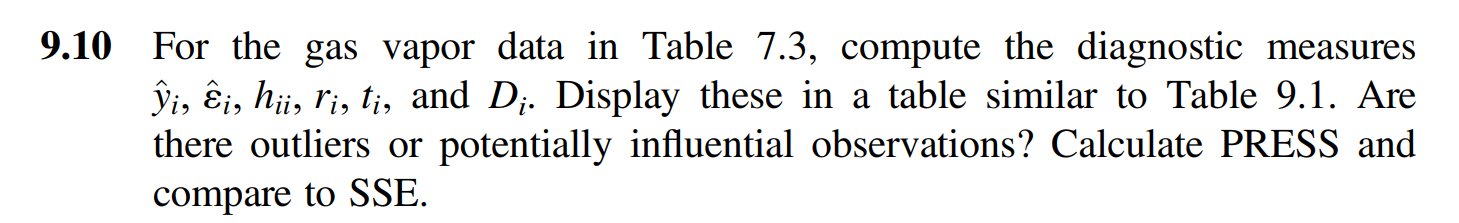
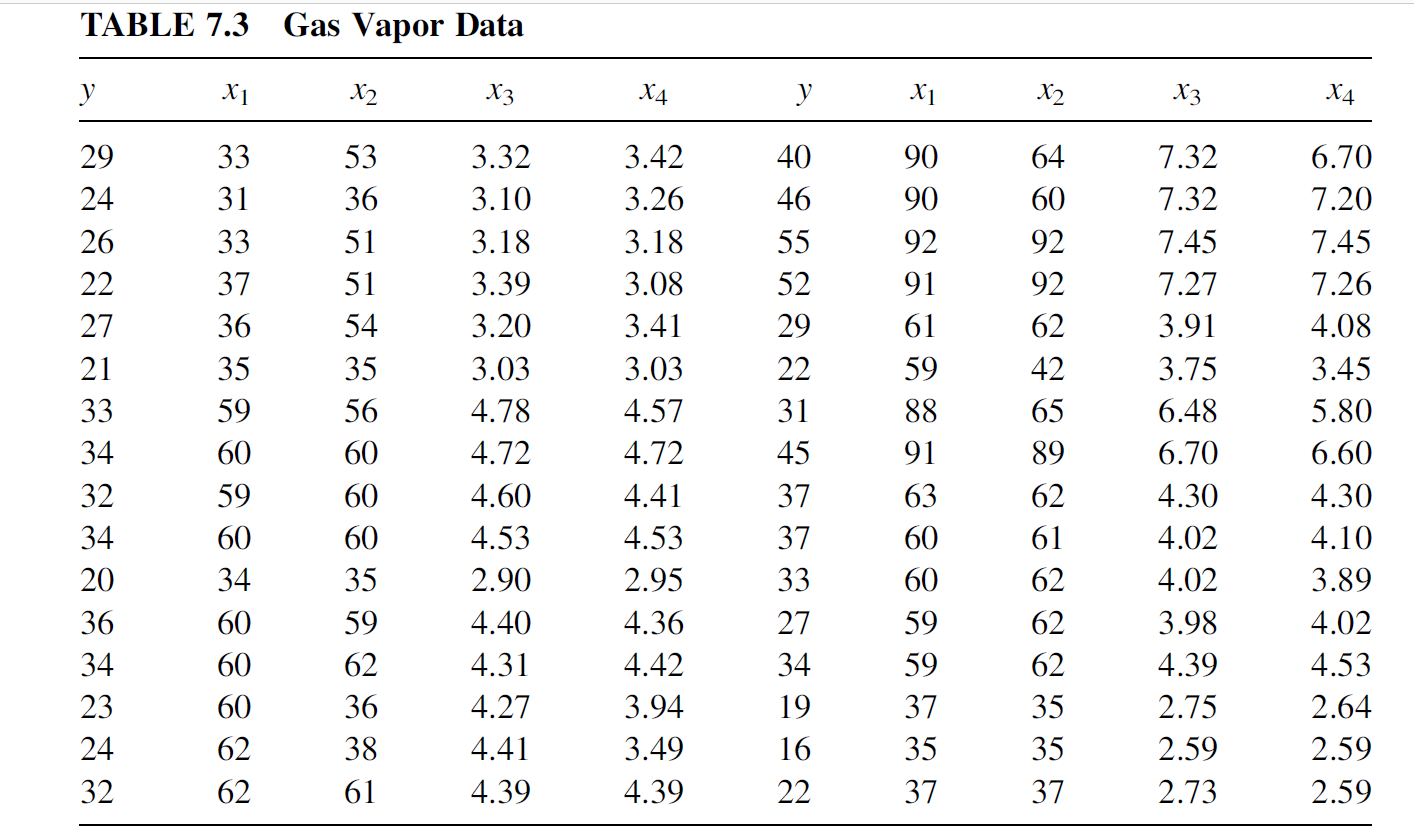
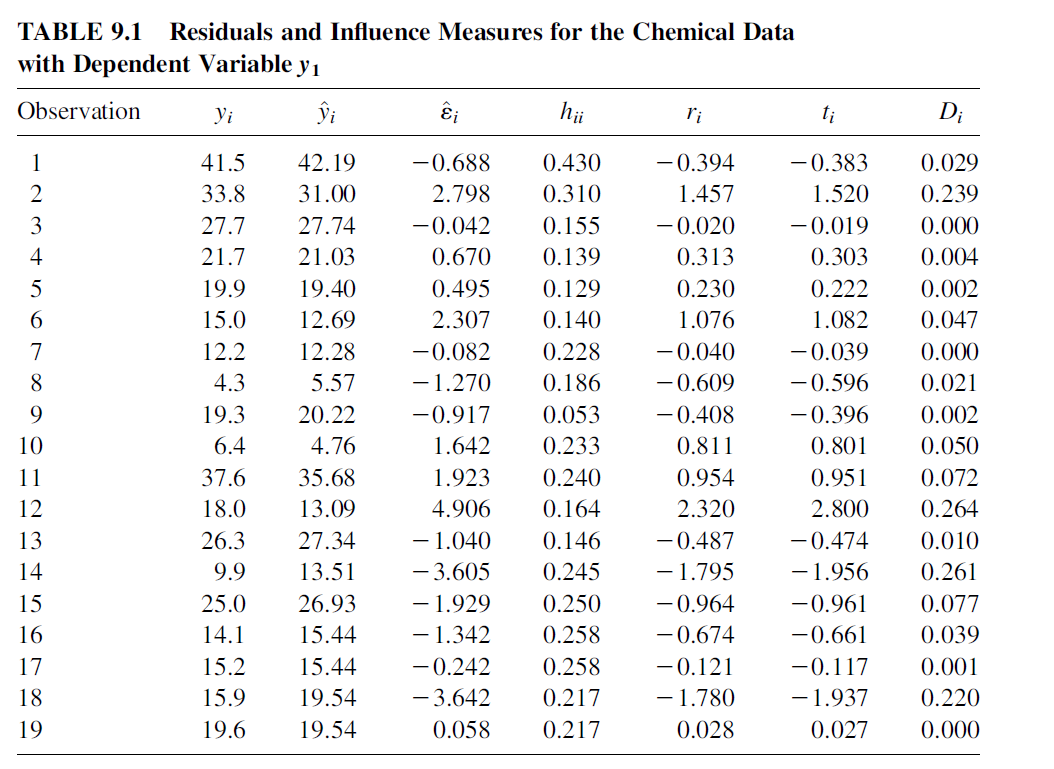
Question: 9.10 For the gas vapor data in Table 7.3, compute the diagnostic measures i, i, hii, li, ti, and Di. Display these in a table

9.10 For the gas vapor data in Table 7.3, compute9.10 For the gas vapor data in Table 7.3, compute9.10 For the gas vapor data in Table 7.3, compute

9.10 For the gas vapor data in Table 7.3, compute the diagnostic measures i, i, hii, li, ti, and Di. Display these in a table similar to Table 9.1. Are there outliers or potentially influential observations? Calculate PRESS and compare to SSE. TABLE 7.3 Gas Vapor Data y X1 12 X3 X4 y X1 X2 X3 X4 29 24 26 22 27 21 33 34 32 34 20 36 34 23 24 33 31 33 37 36 35 59 60 59 60 34 60 60 60 62 53 36 51 51 54 35 56 60 60 60 35 59 62 36 38 3.32 3.10 3.18 3.39 3.20 3.03 4.78 4.72 4.60 4.53 2.90 4.40 4.31 4.27 4.41 3.42 3.26 3.18 3.08 3.41 3.03 4.57 4.72 4.41 4.53 2.95 4.36 4.42 3.94 3.49 40 46 55 52 29 22 31 45 37 37 33 27 34 19 16 90 64 90 60 92 92 91 92 61 62 59 42 88 65 91 89 63 62 60 61 60 62 59 62 59 62 37 35 35 35 37 37 7.32 7.32 7.45 7.27 3.91 3.75 6.48 6.70 4.30 4.02 4.02 3.98 4.39 2.75 2.59 2.73 6.70 7.20 7.45 7.26 4.08 3.45 5.80 6.60 4.30 4.10 3.89 4.02 4.53 2.64 2.59 2.59 32 62 61 4.39 4.39 22 TABLE 9.1 Residuals and Influence Measures for the Chemical Data with Dependent Variable y Observation i i hii l'i ti Di 1 2 3 4 5 6 7 8 9 10 11 12 13 14 15 16 17 18 41.5 33.8 27.7 21.7 19.9 15.0 12.2 4.3 19.3 6.4 37.6 18.0 26.3 9.9 25.0 14.1 15.2 15.9 19.6 42.19 31.00 27.74 21.03 19.40 12.69 12.28 5.57 20.22 4.76 35.68 13.09 27.34 13.51 26.93 15.44 15.44 19.54 19.54 -0.688 2.798 -0.042 0.670 0.495 2.307 -0.082 1.270 -0.917 1.642 1.923 4.906 1.040 - 3.605 - 1.929 1.342 -0.242 - 3.642 0.058 0.430 0.310 0.155 0.139 0.129 0.140 0.228 0.186 0.053 0.233 0.240 0.164 0.146 0.245 0.250 0.258 0.258 0.217 0.217 -0.394 1.457 -0.020 0.313 0.230 1.076 -0.040 -0.609 -0.408 0.811 0.954 2.320 -0.487 -1.795 -0.964 -0.674 -0.121 -1.780 0.028 -0.383 1.520 -0.019 0.303 0.222 1.082 -0.039 -0.596 -0.396 0.801 0.951 2.800 -0.474 -1.956 -0.961 -0.661 -0.117 1.937 0.027 0.029 0.239 0.000 0.004 0.002 0.047 0.000 0.021 0.002 0.050 0.072 0.264 0.010 0.261 0.077 0.039 0.001 0.220 0.000 9.10 For the gas vapor data in Table 7.3, compute the diagnostic measures i, i, hii, li, ti, and Di. Display these in a table similar to Table 9.1. Are there outliers or potentially influential observations? Calculate PRESS and compare to SSE. TABLE 7.3 Gas Vapor Data y X1 12 X3 X4 y X1 X2 X3 X4 29 24 26 22 27 21 33 34 32 34 20 36 34 23 24 33 31 33 37 36 35 59 60 59 60 34 60 60 60 62 53 36 51 51 54 35 56 60 60 60 35 59 62 36 38 3.32 3.10 3.18 3.39 3.20 3.03 4.78 4.72 4.60 4.53 2.90 4.40 4.31 4.27 4.41 3.42 3.26 3.18 3.08 3.41 3.03 4.57 4.72 4.41 4.53 2.95 4.36 4.42 3.94 3.49 40 46 55 52 29 22 31 45 37 37 33 27 34 19 16 90 64 90 60 92 92 91 92 61 62 59 42 88 65 91 89 63 62 60 61 60 62 59 62 59 62 37 35 35 35 37 37 7.32 7.32 7.45 7.27 3.91 3.75 6.48 6.70 4.30 4.02 4.02 3.98 4.39 2.75 2.59 2.73 6.70 7.20 7.45 7.26 4.08 3.45 5.80 6.60 4.30 4.10 3.89 4.02 4.53 2.64 2.59 2.59 32 62 61 4.39 4.39 22 TABLE 9.1 Residuals and Influence Measures for the Chemical Data with Dependent Variable y Observation i i hii l'i ti Di 1 2 3 4 5 6 7 8 9 10 11 12 13 14 15 16 17 18 41.5 33.8 27.7 21.7 19.9 15.0 12.2 4.3 19.3 6.4 37.6 18.0 26.3 9.9 25.0 14.1 15.2 15.9 19.6 42.19 31.00 27.74 21.03 19.40 12.69 12.28 5.57 20.22 4.76 35.68 13.09 27.34 13.51 26.93 15.44 15.44 19.54 19.54 -0.688 2.798 -0.042 0.670 0.495 2.307 -0.082 1.270 -0.917 1.642 1.923 4.906 1.040 - 3.605 - 1.929 1.342 -0.242 - 3.642 0.058 0.430 0.310 0.155 0.139 0.129 0.140 0.228 0.186 0.053 0.233 0.240 0.164 0.146 0.245 0.250 0.258 0.258 0.217 0.217 -0.394 1.457 -0.020 0.313 0.230 1.076 -0.040 -0.609 -0.408 0.811 0.954 2.320 -0.487 -1.795 -0.964 -0.674 -0.121 -1.780 0.028 -0.383 1.520 -0.019 0.303 0.222 1.082 -0.039 -0.596 -0.396 0.801 0.951 2.800 -0.474 -1.956 -0.961 -0.661 -0.117 1.937 0.027 0.029 0.239 0.000 0.004 0.002 0.047 0.000 0.021 0.002 0.050 0.072 0.264 0.010 0.261 0.077 0.039 0.001 0.220 0.000

Step by Step Solution

There are 3 Steps involved in it

1 Expert Approved Answer
Step: 1 Unlock blur-text-image
Question Has Been Solved by an Expert!

Get step-by-step solutions from verified subject matter experts

Step: 2 Unlock
Step: 3 Unlock

Students Have Also Explored These Related General Management Questions!