

Question: 9.11. Figure 9.20 is a scatter plot relating y = percentage of people using cell phones and x = per capita gross domes- tic product
9.11. Figure 9.20 is a scatter plot relatingy= percentage of people using cell phones andx= per capita gross domes- tic product (GDP) for some nations listed in theHuman Development Report.
(a) Give the approximatex- andy-coordinates for the na- tion that has the highest (i) cell phone use, (ii) GDP.
(b) The least squares prediction equation isy? = ?0.13 + 2.62x. For one nation,x= 34.3 andy= 45.1. Find the predicted cell-phone use and the residual. Interpret the residual.
(c) Is the correlation positive, or negative? Explain what it means for the correlation to have this sign.
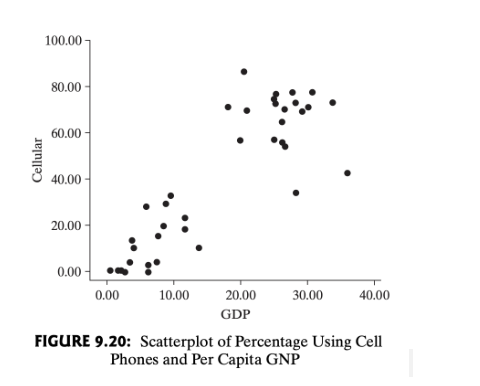
100.00 80.00 60.00 Cellular 40.00 20.00 0.00 0.00 10.00 20.00 30.00 40.00 GDP FIGURE 9.20: Scatterplot of Percentage Using Cell Phones and Per Capita GNP
Step by Step Solution
There are 3 Steps involved in it

Get step-by-step solutions from verified subject matter experts