

Question: Figure 9.20 is a scatterplot relating y =percentage of people using cell phones and x = per capita gross domestic product (GDP) for some nations
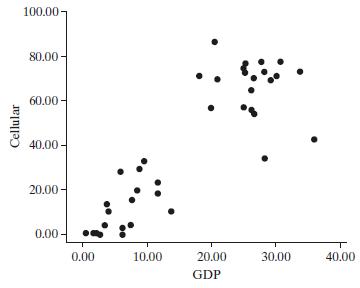
Figure 9.20 is a scatterplot relating y =percentage of people using cell phones and x = per capita gross domestic product (GDP) for some nations listed in the Human Development Report.
(a) Give the approximate x- and y-coordinates for the nation that has the highest (i) cell phone use, (ii) GDP.
(b) The least squares prediction equation is ˆy = −0.13 +
2.62x. For one nation, x = 34.3 and y = 45.1.
Find the predicted cell-phone use and the residual. Interpret the residual.
(c) Is the correlation positive, or negative? Explain what it means for the correlation to have this sign.
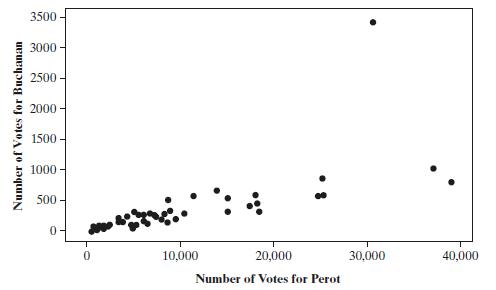
Number of Votes for Buchanan 3500- 3000- 2500- 2000 1500- 1000- 500- 10- 10,000 20,000 30,000 40,000 Number of Votes for Perot
Step by Step Solution
There are 3 Steps involved in it

Get step-by-step solutions from verified subject matter experts