

Question: 9.2 Table 9.17 shows the result of cross-classifying a sample of people from the MBTI Step II National Sample, collected and compiled by CPP,
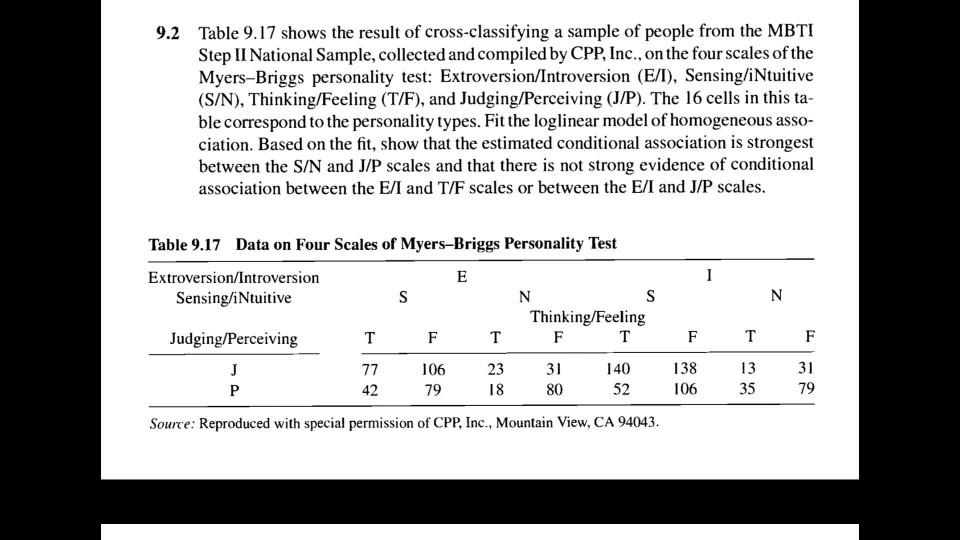
9.2 Table 9.17 shows the result of cross-classifying a sample of people from the MBTI Step II National Sample, collected and compiled by CPP, Inc., on the four scales of the Myers-Briggs personality test: Extroversion/Introversion (E/I), Sensing/iNtuitive (S/N), Thinking/Feeling (T/F), and Judging/Perceiving (J/P). The 16 cells in this ta- ble correspond to the personality types. Fit the loglinear model of homogeneous asso- ciation. Based on the fit, show that the estimated conditional association is strongest between the S/N and J/P scales and that there is not strong evidence of conditional association between the E/I and T/F scales or between the E/I and J/P scales. Table 9.17 Data on Four Scales of Myers-Briggs Personality Test Extroversion/Introversion E I Sensing/iNtuitive S N S N Thinking/Feeling F T Judging/Perceiving T F T F T F J 77 106 23 31 140 138 13 31 P 42 79 18 80 52 106 35 79 Source: Reproduced with special permission of CPP, Inc., Mountain View, CA 94043.
Step by Step Solution
There are 3 Steps involved in it
Stepbystep explanation Based on the output the log linear model is logitp032... View full answer

Get step-by-step solutions from verified subject matter experts