Question: 9.6 Apply a numerical optimization technique to calculate the cost-optimal values of the decision variables for the cogeneration system case study using the levelized costs
9.6 Apply a numerical optimization technique to calculate the cost-optimal values of the decision variables for the cogeneration system case study using the levelized costs in current dollars for a 20-year period from Table 7.12. Discuss the differences between the values obtained here and the values reported in Table 9.1.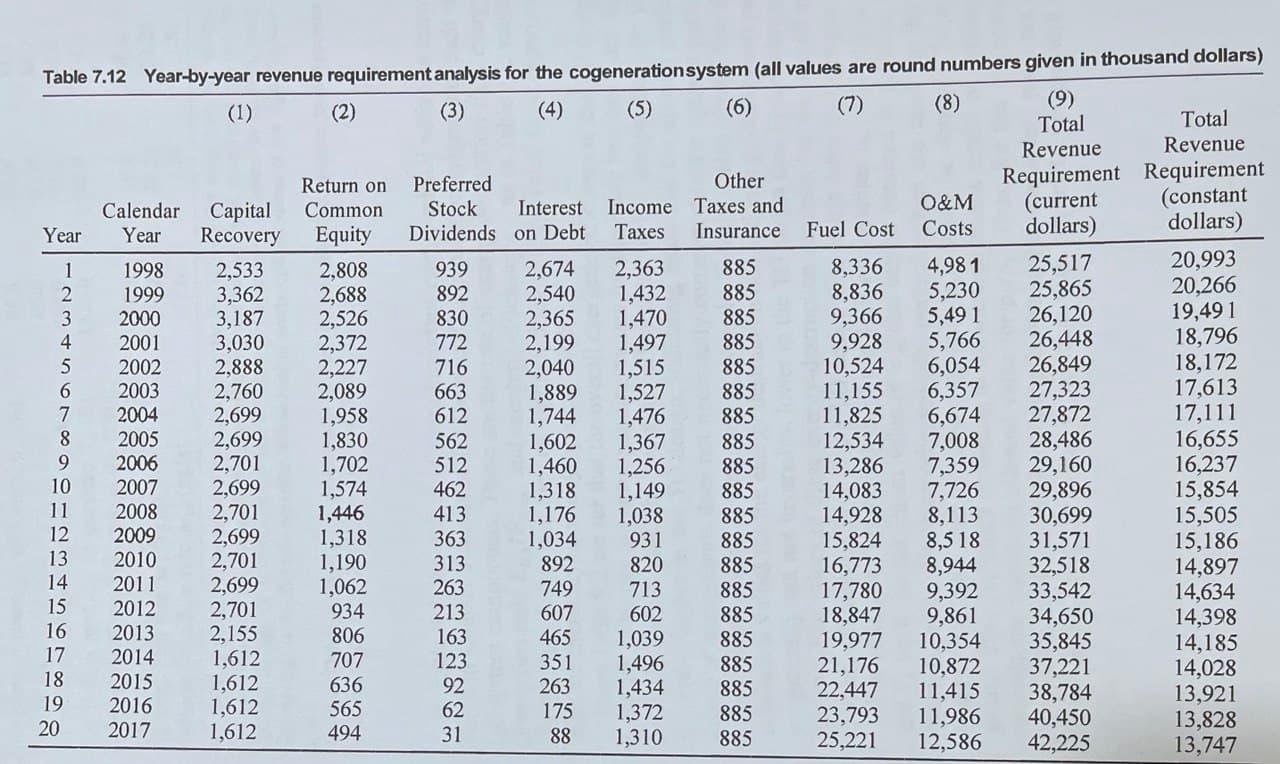
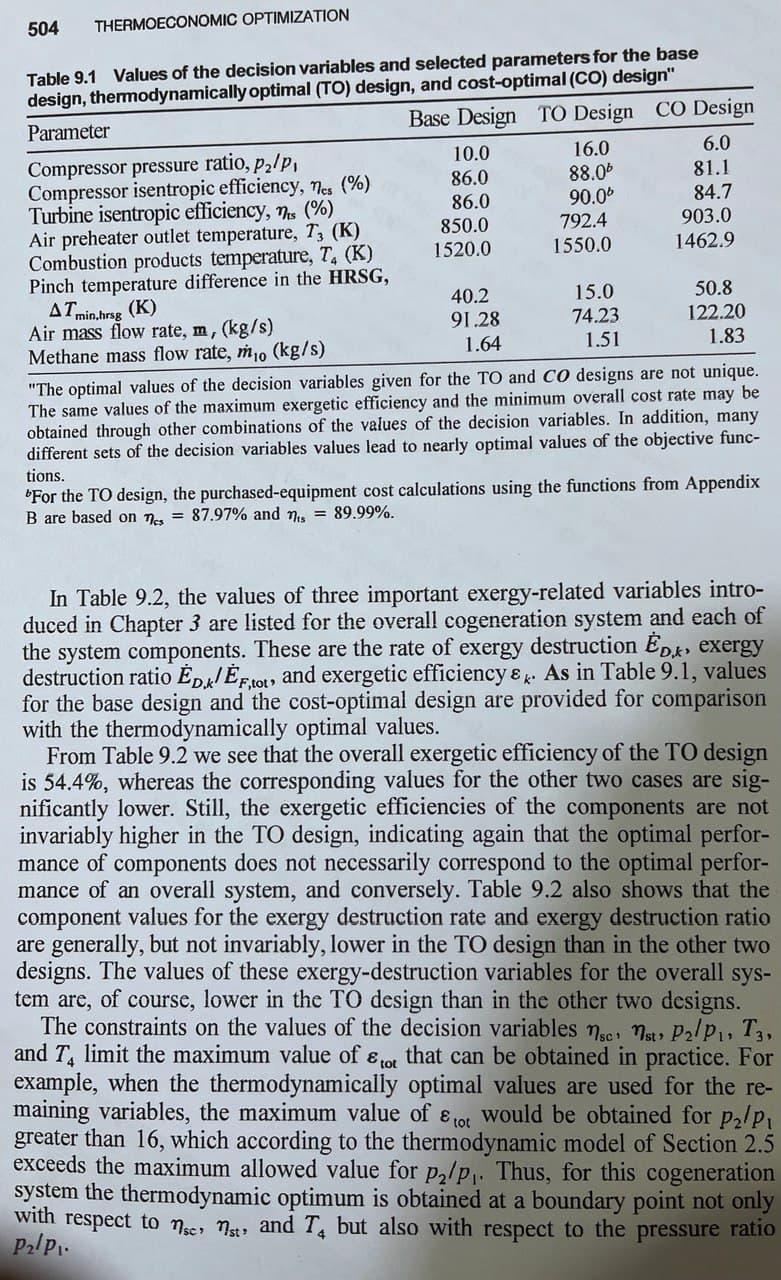
663 Table 7.12 Year-by-year revenue requirement analysis for the cogeneration system (all values are round numbers given in thousand dollars) (1) (2) (3) (4) (5) (6) (7) (8) (9) Total Total Revenue Revenue Return on Preferred Other Requirement Requirement Calendar Common Capital Stock Interest Income Taxes and O&M (constant (current Year Year Recovery Equity Dividends on Debt Taxes Insurance Fuel Cost dollars) Costs dollars) 1 1998 2,533 2,808 939 2,674 2,363 885 8,336 4,981 25,517 20,993 2 1999 3,362 2,688 892 2,540 1,432 885 8,836 5,230 25,865 20,266 3 2000 3,187 2,526 830 2,365 1,470 885 9,366 5,491 26,120 19,491 4 2001 3,030 2,372 772 2,199 1,497 885 9,928 5,766 26,448 18,796 5 2002 2,888 2,227 716 2,040 1,515 885 10,524 6,054 26,849 18,172 6 2003 2,760 2,089 1,889 1,527 885 11,155 6,357 27,323 17,613 7 2004 2,699 1,958 612 1,744 1,476 885 11,825 6,674 27,872 17,111 8 2005 2,699 1,830 562 1,602 1,367 885 12,534 7,008 28,486 16,655 9 2006 2,701 1,702 512 1,460 1,256 885 13,286 7,359 29,160 16,237 10 2007 2,699 1,574 462 1,318 1,149 885 14,083 7,726 29,896 15,854 2008 2,701 1,446 413 1,176 1,038 885 14,928 8,113 30,699 15,505 12 2009 2,699 1,318 363 1,034 931 885 15,824 8,518 31,571 15,186 13 2010 2,701 1,190 313 892 820 885 16,773 8,944 32,518 14,897 14 2011 2,699 1,062 263 749 713 885 17,780 9,392 33,542 15 14,634 2012 2,701 934 213 607 602 885 18,847 9,861 16 34,650 14,398 2013 2.155 806 163 1,039 885 19,977 17 10,354 35,845 2014 14,185 1,612 707 351 1,496 885 21,176 18 2015 10,872 37,221 1,612 14,028 636 92 263 1,434 885 22,447 19 11,415 2016 1,612 38,784 565 13,921 62 175 1,372 885 23,793 20 2017 11,986 1,612 40,450 494 13,828 31 88 1,310 885 25,221 12,586 42,225 13,747 465 123 504 THERMOECONOMIC OPTIMIZATION Table 9.1 Values of the decision variables and selected parameters for the base design, thermodynamically optimal (TO) design, and cost-optimal (CO) design" Parameter Base Design TO Design CO Design 10.0 16.0 6.0 Compressor pressure ratio, pzlp, 86.0 88.06 81.1 Compressor isentropic efficiency, Mes (%) Turbine isentropic efficiency, Ys (%) 86.0 90.0% 84.7 Air preheater outlet temperature, Tz (K) 850.0 792.4 903.0 Combustion products temperature, T. (K) 1520.0 1550.0 1462.9 Pinch temperature difference in the HRSG, AT min.hrsg (K) 40.2 15.0 50.8 Air mass flow rate, m, (kg/s) 91.28 74.23 122.20 Methane mass flow rate, mo (kg/s) 1.64 1.51 1.83 "The optimal values of the decision variables given for the TO and Co designs are not unique. The same values of the maximum exergetic efficiency and the minimum overall cost rate may be obtained through other combinations of the values of the decision variables. In addition, many different sets of the decision variables values lead to nearly optimal values of the objective func- tions. For the TO design, the purchased-equipment cost calculations using the functions from Appendix B are based on mes = 87.97% and his = 89.99%. In Table 9.2, the values of three important exergy-related variables intro- duced in Chapter 3 are listed for the overall cogeneration system and each of the system components. These are the rate of exergy destruction p.x, exergy destruction ratio Df,tot, and exergetic efficiency & k. As in Table 9.1, values for the base design and the cost-optimal design are provided for comparison with the thermodynamically optimal values. From Table 9.2 we see that the overall exergetic efficiency of the TO design is 54.4%, whereas the corresponding values for the other two cases are sig- nificantly lower. Still, the exergetic efficiencies of the components are not invariably higher in the TO design, indicating again that the optimal perfor- mance of components does not necessarily correspond to the optimal perfor- mance of an overall system, and conversely. Table 9.2 also shows that the component values for the exergy destruction rate and exergy destruction ratio are generally, but not invariably, lower in the TO design than in the other two designs. The values of these exergy-destruction variables for the overall sys- tem are, of course, lower in the TO design than in the other two designs. The constraints on the values of the decision variables sc 1st, P2/P, T3, and T. limit the maximum value of tot that can be obtained in practice. For example, when the thermodynamically optimal values are used for the re- maining variables, the maximum value of tor would be obtained for pz/p. greater than 16, which according to the thermodynamic model of Section 2.5 exceeds the maximum allowed value for pz/p.. Thus, for this cogeneration system the thermodynamic optimum is obtained at a boundary point not only with respect to noc, mist, and T. but also with respect to the pressure ratio pa/p.. 663 Table 7.12 Year-by-year revenue requirement analysis for the cogeneration system (all values are round numbers given in thousand dollars) (1) (2) (3) (4) (5) (6) (7) (8) (9) Total Total Revenue Revenue Return on Preferred Other Requirement Requirement Calendar Common Capital Stock Interest Income Taxes and O&M (constant (current Year Year Recovery Equity Dividends on Debt Taxes Insurance Fuel Cost dollars) Costs dollars) 1 1998 2,533 2,808 939 2,674 2,363 885 8,336 4,981 25,517 20,993 2 1999 3,362 2,688 892 2,540 1,432 885 8,836 5,230 25,865 20,266 3 2000 3,187 2,526 830 2,365 1,470 885 9,366 5,491 26,120 19,491 4 2001 3,030 2,372 772 2,199 1,497 885 9,928 5,766 26,448 18,796 5 2002 2,888 2,227 716 2,040 1,515 885 10,524 6,054 26,849 18,172 6 2003 2,760 2,089 1,889 1,527 885 11,155 6,357 27,323 17,613 7 2004 2,699 1,958 612 1,744 1,476 885 11,825 6,674 27,872 17,111 8 2005 2,699 1,830 562 1,602 1,367 885 12,534 7,008 28,486 16,655 9 2006 2,701 1,702 512 1,460 1,256 885 13,286 7,359 29,160 16,237 10 2007 2,699 1,574 462 1,318 1,149 885 14,083 7,726 29,896 15,854 2008 2,701 1,446 413 1,176 1,038 885 14,928 8,113 30,699 15,505 12 2009 2,699 1,318 363 1,034 931 885 15,824 8,518 31,571 15,186 13 2010 2,701 1,190 313 892 820 885 16,773 8,944 32,518 14,897 14 2011 2,699 1,062 263 749 713 885 17,780 9,392 33,542 15 14,634 2012 2,701 934 213 607 602 885 18,847 9,861 16 34,650 14,398 2013 2.155 806 163 1,039 885 19,977 17 10,354 35,845 2014 14,185 1,612 707 351 1,496 885 21,176 18 2015 10,872 37,221 1,612 14,028 636 92 263 1,434 885 22,447 19 11,415 2016 1,612 38,784 565 13,921 62 175 1,372 885 23,793 20 2017 11,986 1,612 40,450 494 13,828 31 88 1,310 885 25,221 12,586 42,225 13,747 465 123 504 THERMOECONOMIC OPTIMIZATION Table 9.1 Values of the decision variables and selected parameters for the base design, thermodynamically optimal (TO) design, and cost-optimal (CO) design" Parameter Base Design TO Design CO Design 10.0 16.0 6.0 Compressor pressure ratio, pzlp, 86.0 88.06 81.1 Compressor isentropic efficiency, Mes (%) Turbine isentropic efficiency, Ys (%) 86.0 90.0% 84.7 Air preheater outlet temperature, Tz (K) 850.0 792.4 903.0 Combustion products temperature, T. (K) 1520.0 1550.0 1462.9 Pinch temperature difference in the HRSG, AT min.hrsg (K) 40.2 15.0 50.8 Air mass flow rate, m, (kg/s) 91.28 74.23 122.20 Methane mass flow rate, mo (kg/s) 1.64 1.51 1.83 "The optimal values of the decision variables given for the TO and Co designs are not unique. The same values of the maximum exergetic efficiency and the minimum overall cost rate may be obtained through other combinations of the values of the decision variables. In addition, many different sets of the decision variables values lead to nearly optimal values of the objective func- tions. For the TO design, the purchased-equipment cost calculations using the functions from Appendix B are based on mes = 87.97% and his = 89.99%. In Table 9.2, the values of three important exergy-related variables intro- duced in Chapter 3 are listed for the overall cogeneration system and each of the system components. These are the rate of exergy destruction p.x, exergy destruction ratio Df,tot, and exergetic efficiency & k. As in Table 9.1, values for the base design and the cost-optimal design are provided for comparison with the thermodynamically optimal values. From Table 9.2 we see that the overall exergetic efficiency of the TO design is 54.4%, whereas the corresponding values for the other two cases are sig- nificantly lower. Still, the exergetic efficiencies of the components are not invariably higher in the TO design, indicating again that the optimal perfor- mance of components does not necessarily correspond to the optimal perfor- mance of an overall system, and conversely. Table 9.2 also shows that the component values for the exergy destruction rate and exergy destruction ratio are generally, but not invariably, lower in the TO design than in the other two designs. The values of these exergy-destruction variables for the overall sys- tem are, of course, lower in the TO design than in the other two designs. The constraints on the values of the decision variables sc 1st, P2/P, T3, and T. limit the maximum value of tot that can be obtained in practice. For example, when the thermodynamically optimal values are used for the re- maining variables, the maximum value of tor would be obtained for pz/p. greater than 16, which according to the thermodynamic model of Section 2.5 exceeds the maximum allowed value for pz/p.. Thus, for this cogeneration system the thermodynamic optimum is obtained at a boundary point not only with respect to noc, mist, and T. but also with respect to the pressure ratio pa/p


