

Question: 9.LLX Using the data in the following table, estimate the average return and volatility for each stock (see MyFinanceLab for the data in Excel format)
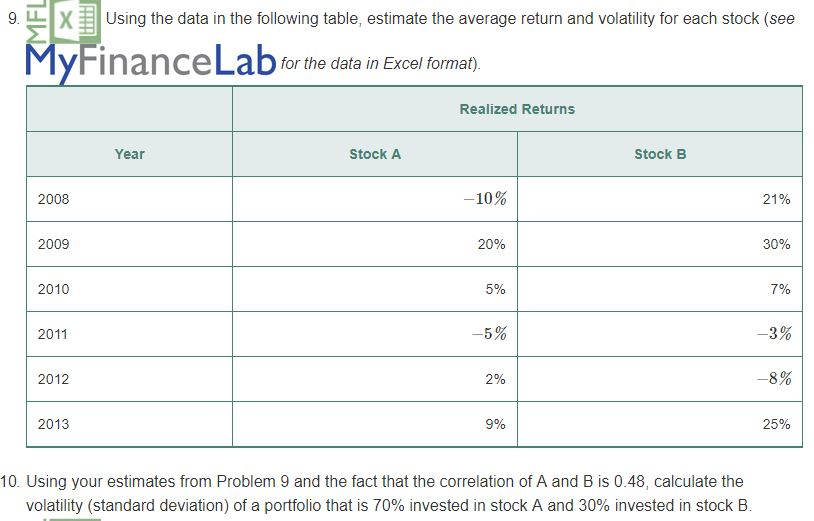
9.LLX Using the data in the following table, estimate the average return and volatility for each stock (see MyFinanceLab for the data in Excel format) Realized Returns Year Stock A Stock EB 2008 10% 21% 2009 20% 30% 2010 5% 7% 2011 3% 2012 2% 8% 2013 9% 25% 10. Using your estimates from Problem 9 and the fact that the correlation of A and B is 0.48, calculate the volatility (standard deviation) of a portfolio that is 70% invested in stock A and 30% invested in stock B
Step by Step Solution
There are 3 Steps involved in it
1 Expert Approved Answer
Step: 1 Unlock

Question Has Been Solved by an Expert!
Get step-by-step solutions from verified subject matter experts
Step: 2 Unlock
Step: 3 Unlock