

Question: A 1 Assignment Instructions for Stratification/Pivot Table Assignment: 2 Use the Pivot Table function within Excel to carry out a stratification analysis of the
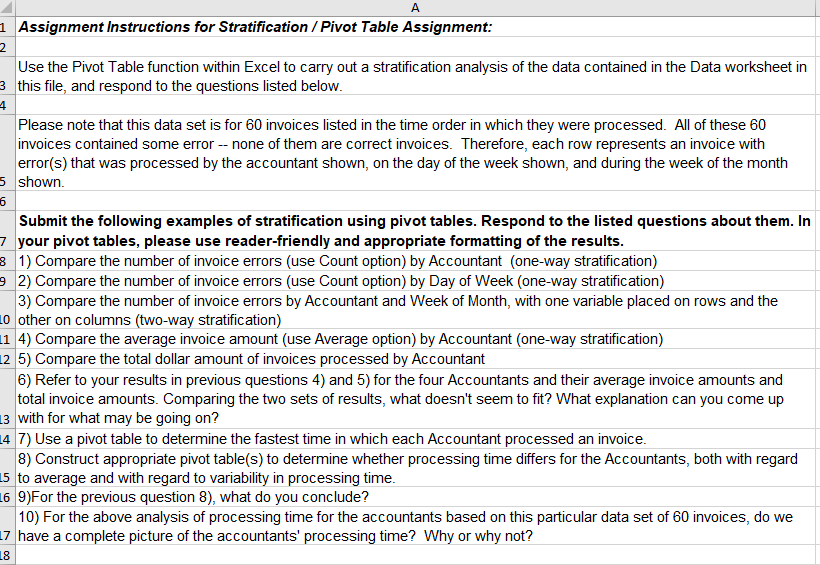
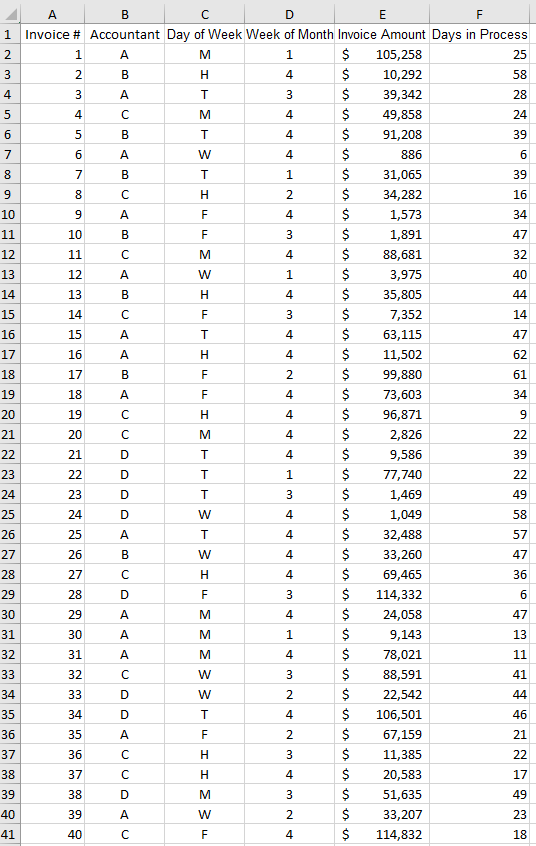
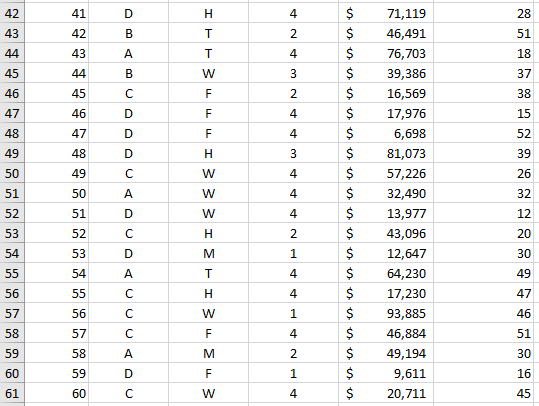
A 1 Assignment Instructions for Stratification/Pivot Table Assignment: 2 Use the Pivot Table function within Excel to carry out a stratification analysis of the data contained in the Data worksheet in 3 this file, and respond to the questions listed below. 4 Please note that this data set is for 60 invoices listed in the time order in which they were processed. All of these 60 invoices contained some error -- none of them are correct invoices. Therefore, each row represents an invoice with error(s) that was processed by the accountant shown, on the day of the week shown, and during the week of the month 5 shown. 6 Submit the following examples of stratification using pivot tables. Respond to the listed questions about them. In 7 your pivot tables, please use reader-friendly and appropriate formatting of the results. 8 1) Compare the number of invoice errors (use Count option) by Accountant (one-way stratification) 9 2) Compare the number of invoice errors (use Count option) by Day of Week (one-way stratification) 3) Compare the number of invoice errors by Accountant and Week of Month, with one variable placed on rows and the 10 other on columns (two-way stratification) 11 4) Compare the average invoice amount (use Average option) by Accountant (one-way stratification) 12 5) Compare the total dollar amount of invoices processed by Accountant 6) Refer to your results in previous questions 4) and 5) for the four Accountants and their average invoice amounts and total invoice amounts. Comparing the two sets of results, what doesn't seem to fit? What explanation can you come up 3 with for what may be going on? 14 7) Use a pivot table to determine the fastest time in which each Accountant processed an invoice. 8) Construct appropriate pivot table(s) to determine whether processing time differs for the Accountants, both with regard 15 to average and with regard to variability in processing time. 16 9)For the previous question 8), what do you conclude? 10) For the above analysis of processing time for the accountants based on this particular data set of 60 invoices, do we 17 have a complete picture of the accountants' processing time? Why or why not? 18
Step by Step Solution
There are 3 Steps involved in it

Get step-by-step solutions from verified subject matter experts