

Question: a 1. Recall the VaR (value at risk) example we did in class (BBKB Chapter 2 Excel Example uploaded on D2L). In that example, we
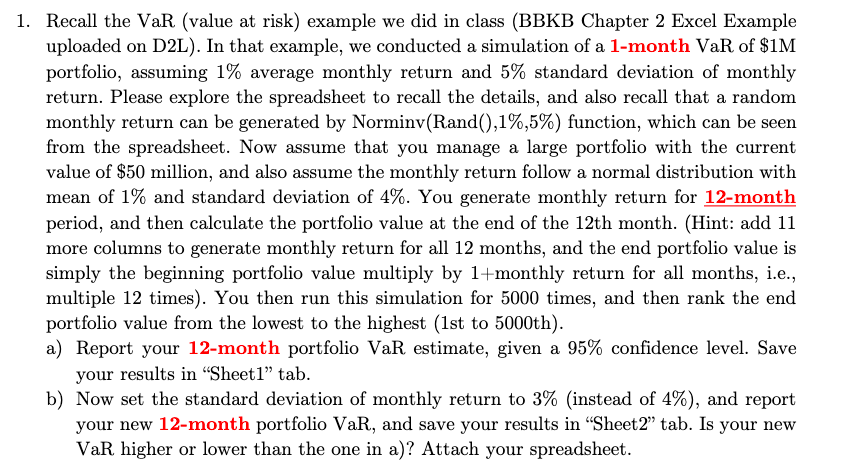
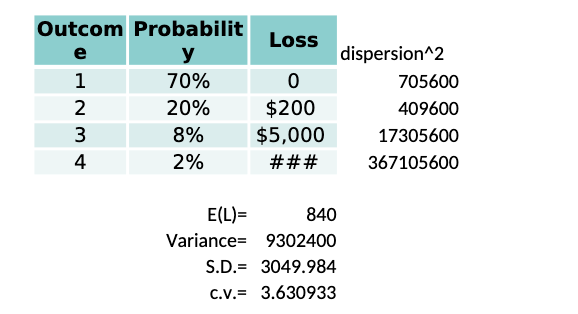
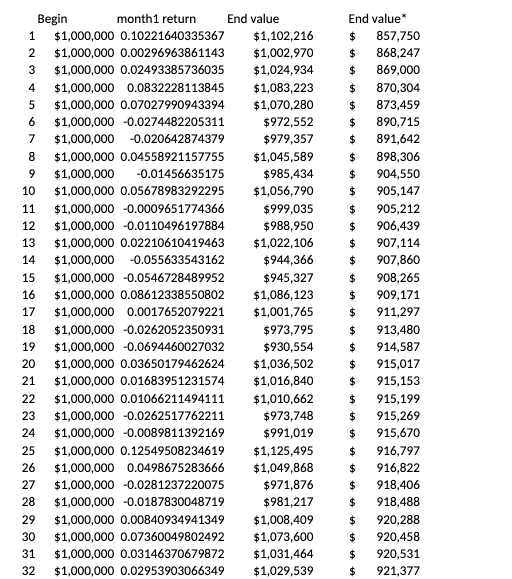
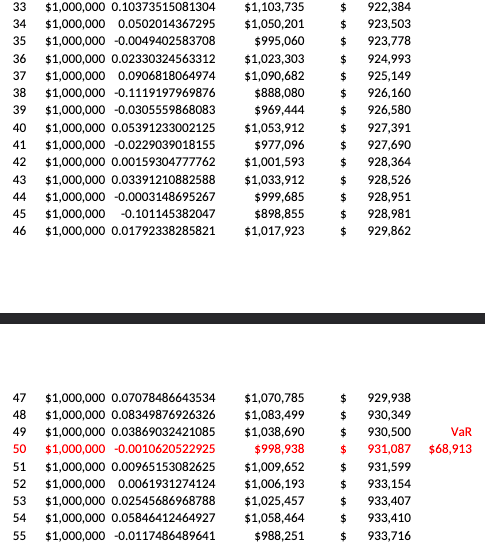
a 1. Recall the VaR (value at risk) example we did in class (BBKB Chapter 2 Excel Example uploaded on D2L). In that example, we conducted a simulation of a 1-month VaR of $1M portfolio, assuming 1% average monthly return and 5% standard deviation of monthly return. Please explore the spreadsheet to recall the details, and also recall that a random monthly return can be generated by Norminv(Rand(),1%,5%) function, which can be seen from the spreadsheet. Now assume that you manage a large portfolio with the current value of $50 million, and also assume the monthly return follow a normal distribution with mean of 1% and standard deviation of 4%. You generate monthly return for 12-month period, and then calculate the portfolio value at the end of the 12th month. (Hint: add 11 more columns to generate monthly return for all 12 months, and the end portfolio value is simply the beginning portfolio value multiply by 1+monthly return for all months, i.e., multiple 12 times). You then run this simulation for 5000 times, and then rank the end portfolio value from the lowest to the highest (1st to 5000th). a) Report your 12-month portfolio VaR estimate, given a 95% confidence level. Save your results in "Sheet1" tab. b) Now set the standard deviation of monthly return to 3% (instead of 4%), and report your new 12-month portfolio VaR, and save your results in Sheet2" tab. Is your new VaR higher or lower than the one in a)? Attach your spreadsheet. Outcom Probabilit e Loss 1 70% o 0 2 20% $200 3 8% $5,000 4 2% ### dispersion^2 705600 409600 17305600 367105600 E(L)= 840 Variance= 9302400 S.D.= 3049.984 C.V.= 3.630933 AN Begin month1 return End value 1 $1,000,000 0.10221640335367 $1,102,216 2 $1,000,000 0.00296963861143 $1,002,970 3 $1,000,000 0.02493385736035 $1,024,934 4 $1,000,000 0.0832228113845 $1,083,223 5 $1,000,000 0.07027990943394 $1,070,280 6 $1,000,000 -0.0274482205311 $972,552 7 $1,000,000 -0.020642874379 $979,357 8 $1,000,000 0.04558921157755 $1,045,589 9 $1,000,000 -0.01456635175 $985,434 10 $1,000,000 0.05678983292295 $1,056,790 11 $1,000,000 -0.0009651774366 $999,035 12 $1,000,000 -0.0110496197884 $988,950 13 $1,000,000 0.02210610419463 $1,022, 106 14 $1,000,000 -0.055633543162 $944,366 15 $1,000,000 -0.0546728489952 $945,327 16 $1,000,000 0.08612338550802 $1,086,123 17 $1,000,000 0.0017652079221 $1,001,765 18 $1,000,000 -0.0262052350931 $973,795 19 $1,000,000 -0.0694460027032 $930,554 20 $1,000,000 0.03650179462624 $1,036,502 21 $1,000,000 0.01683951231574 $1,016,840 22 $1,000,000 0.01066211494111 $1,010,662 23 $1,000,000 -0.0262517762211 $973,748 24 $1,000,000 -0.0089811392169 $991,019 25 $1,000,000 0.12549508234619 $1,125,495 26 $1,000,000 0.0498675283666 $1,049,868 27 $1,000,000 -0.0281237220075 $971,876 28 $1,000,000 -0.0187830048719 $981,217 29 $1,000,000 0.00840934941349 $1,008,409 30 $1,000,000 0.07360049802492 $1,073,600 31 $1,000,000 0.03146370679872 $1,031,464 32 $1,000,000 0.02953903066349 $1,029,539 End value $ 857,750 $ 868,247 $ 869,000 $ 870,304 $ 873,459 $ 890,715 $ 891,642 $ 898,306 $ 904,550 $ 905,147 $ 905,212 $ 906,439 $ 907,114 $ 907,860 $ 908,265 $ 909,171 $ 911,297 $ 913,480 $ 914,587 $ 915,017 $ 915,153 $ 915,199 $ 915,269 $ 915,670 $ 916,797 $ 916,822 $ 918,406 $ 918,488 $ 920,288 $ 920,458 $ 920,531 $ 921,377 33 34 35 36 37 38 39 40 $1,000,000 0.10373515081304 $1,000,000 0.0502014367295 $1,000,000 -0.0049402583708 $1,000,000 0.02330324563312 $1,000,000 0.0906818064974 $1,000,000 -0.1119197969876 $1,000,000 -0.0305559868083 $1,000,000 0.05391233002125 $1,000,000 -0.0229039018155 $1,000,000 0.00159304777762 $1,000,000 0.03391210882588 $1,000,000 0.0003148695267 $1,000,000 -0.101145382047 $1,000,000 0.01792338285821 $1,103,735 $1,050,201 $995,060 $1,023,303 $1,090,682 $888,080 $969,444 $1,053,912 $977,096 $1,001,593 $1,033,912 $999,685 $898,855 $1,017,923 $ $ $ $ $ $ $ $ $ $ $ $ $ $ 922,384 923,503 923,778 924,993 925,149 926,160 926,580 927,391 927,690 928,364 928,526 928,951 928,981 929,862 41 42 43 44 45 46 47 48 49 50 51 52 53 54 55 VaR $68,913 $1,000,000 0.07078486643534 $1,000,000 0.08349876926326 $1,000,000 0.03869032421085 $1,000,000 -0.0010620522925 $1,000,000 0.00965153082625 $1,000,000 0.0061931274124 $1,000,000 0.02545686968788 $1,000,000 0.05846412464927 $1,000,000 -0.0117486489641 $1,070,785 $1,083,499 $1,038,690 $998,938 $1,009,652 $1,006,193 $1,025,457 $1,058,464 $988,251 $ $ $ $ $ $ $ 929,938 930,349 930,500 931,087 931,599 933,154 933,407 933,410 933,716 $ $ a 1. Recall the VaR (value at risk) example we did in class (BBKB Chapter 2 Excel Example uploaded on D2L). In that example, we conducted a simulation of a 1-month VaR of $1M portfolio, assuming 1% average monthly return and 5% standard deviation of monthly return. Please explore the spreadsheet to recall the details, and also recall that a random monthly return can be generated by Norminv(Rand(),1%,5%) function, which can be seen from the spreadsheet. Now assume that you manage a large portfolio with the current value of $50 million, and also assume the monthly return follow a normal distribution with mean of 1% and standard deviation of 4%. You generate monthly return for 12-month period, and then calculate the portfolio value at the end of the 12th month. (Hint: add 11 more columns to generate monthly return for all 12 months, and the end portfolio value is simply the beginning portfolio value multiply by 1+monthly return for all months, i.e., multiple 12 times). You then run this simulation for 5000 times, and then rank the end portfolio value from the lowest to the highest (1st to 5000th). a) Report your 12-month portfolio VaR estimate, given a 95% confidence level. Save your results in "Sheet1" tab. b) Now set the standard deviation of monthly return to 3% (instead of 4%), and report your new 12-month portfolio VaR, and save your results in Sheet2" tab. Is your new VaR higher or lower than the one in a)? Attach your spreadsheet. Outcom Probabilit e Loss 1 70% o 0 2 20% $200 3 8% $5,000 4 2% ### dispersion^2 705600 409600 17305600 367105600 E(L)= 840 Variance= 9302400 S.D.= 3049.984 C.V.= 3.630933 AN Begin month1 return End value 1 $1,000,000 0.10221640335367 $1,102,216 2 $1,000,000 0.00296963861143 $1,002,970 3 $1,000,000 0.02493385736035 $1,024,934 4 $1,000,000 0.0832228113845 $1,083,223 5 $1,000,000 0.07027990943394 $1,070,280 6 $1,000,000 -0.0274482205311 $972,552 7 $1,000,000 -0.020642874379 $979,357 8 $1,000,000 0.04558921157755 $1,045,589 9 $1,000,000 -0.01456635175 $985,434 10 $1,000,000 0.05678983292295 $1,056,790 11 $1,000,000 -0.0009651774366 $999,035 12 $1,000,000 -0.0110496197884 $988,950 13 $1,000,000 0.02210610419463 $1,022, 106 14 $1,000,000 -0.055633543162 $944,366 15 $1,000,000 -0.0546728489952 $945,327 16 $1,000,000 0.08612338550802 $1,086,123 17 $1,000,000 0.0017652079221 $1,001,765 18 $1,000,000 -0.0262052350931 $973,795 19 $1,000,000 -0.0694460027032 $930,554 20 $1,000,000 0.03650179462624 $1,036,502 21 $1,000,000 0.01683951231574 $1,016,840 22 $1,000,000 0.01066211494111 $1,010,662 23 $1,000,000 -0.0262517762211 $973,748 24 $1,000,000 -0.0089811392169 $991,019 25 $1,000,000 0.12549508234619 $1,125,495 26 $1,000,000 0.0498675283666 $1,049,868 27 $1,000,000 -0.0281237220075 $971,876 28 $1,000,000 -0.0187830048719 $981,217 29 $1,000,000 0.00840934941349 $1,008,409 30 $1,000,000 0.07360049802492 $1,073,600 31 $1,000,000 0.03146370679872 $1,031,464 32 $1,000,000 0.02953903066349 $1,029,539 End value $ 857,750 $ 868,247 $ 869,000 $ 870,304 $ 873,459 $ 890,715 $ 891,642 $ 898,306 $ 904,550 $ 905,147 $ 905,212 $ 906,439 $ 907,114 $ 907,860 $ 908,265 $ 909,171 $ 911,297 $ 913,480 $ 914,587 $ 915,017 $ 915,153 $ 915,199 $ 915,269 $ 915,670 $ 916,797 $ 916,822 $ 918,406 $ 918,488 $ 920,288 $ 920,458 $ 920,531 $ 921,377 33 34 35 36 37 38 39 40 $1,000,000 0.10373515081304 $1,000,000 0.0502014367295 $1,000,000 -0.0049402583708 $1,000,000 0.02330324563312 $1,000,000 0.0906818064974 $1,000,000 -0.1119197969876 $1,000,000 -0.0305559868083 $1,000,000 0.05391233002125 $1,000,000 -0.0229039018155 $1,000,000 0.00159304777762 $1,000,000 0.03391210882588 $1,000,000 0.0003148695267 $1,000,000 -0.101145382047 $1,000,000 0.01792338285821 $1,103,735 $1,050,201 $995,060 $1,023,303 $1,090,682 $888,080 $969,444 $1,053,912 $977,096 $1,001,593 $1,033,912 $999,685 $898,855 $1,017,923 $ $ $ $ $ $ $ $ $ $ $ $ $ $ 922,384 923,503 923,778 924,993 925,149 926,160 926,580 927,391 927,690 928,364 928,526 928,951 928,981 929,862 41 42 43 44 45 46 47 48 49 50 51 52 53 54 55 VaR $68,913 $1,000,000 0.07078486643534 $1,000,000 0.08349876926326 $1,000,000 0.03869032421085 $1,000,000 -0.0010620522925 $1,000,000 0.00965153082625 $1,000,000 0.0061931274124 $1,000,000 0.02545686968788 $1,000,000 0.05846412464927 $1,000,000 -0.0117486489641 $1,070,785 $1,083,499 $1,038,690 $998,938 $1,009,652 $1,006,193 $1,025,457 $1,058,464 $988,251 $ $ $ $ $ $ $ 929,938 930,349 930,500 931,087 931,599 933,154 933,407 933,410 933,716 $ $
Step by Step Solution
There are 3 Steps involved in it

Get step-by-step solutions from verified subject matter experts